The modelling allows to take different assumption on the geometry of the structure into account, and to study several parametres which may influence the creation of zones of deformation (plastic), diffuse or highly localised. The studied parametres are the internal geometry of the structure (in particular, the hypothesis of a fold propagation fault) and the mechanical properties of the rocks (the cohesion especially).
The results of models with or without the presence of a major "listric" fault below the anticline (assumption of detachment folding) are very different.
RÉSUMÉ (abstract in French)
Le but de ce travail était d'étudier l'évolution
et la distribution spatiale des contraintes et de la fracturation
dans la structure Garret El Gueffoul, Algérie, à
l'aide d'une modélisation éléments finis
en deux dimensions. A partir des données disponibles (coupe
sismiques réflexions et cartes structurales des principaux
horizons) plusieurs interprétations de la structure anticlinale
du champ, selon une coupe profondeur EW, ont été
modélisées pour réaliser les calculs des
contraintes et déformations avec le code éléments
finis TECTON. Avec ce programme éléments finis,
on propose d'interpréter les zones de plasticité
localisées (bandes de cisaillement) comme la possibilité
de création de failles secondaires et les zones de plasticité
diffuses comme une fracturation dans les roches fragiles.
La modélisation nous permet de prendre en compte différentes
hypothèses géologiques pour la géométrie
de la structure et d'étudier plusieurs paramètres
pouvant influencer la formation de zones de déformation
plastique, diffuses ou bien localisées. Les paramètres
étudiés sont la géométrie interne
de la structure (en particulier, l'hypothèse d'une pli
de propagation) et les propriétés mécaniques
des matériaux (notamment la cohésion).
Les résultats des modèles avec ou sans la présence
d'une faille majeure "listrique" sous l'anticlinal (hypothèse
d'un pli de détachement) sont très différents.
La réactivation partielle de la faille listrique conduit
au développement de plusieurs bandes de cisaillements.
Ces zones de cisaillement (qui sont interprétées
comme failles secondaires) apparaissent dans le compartiment mobile
de la faille et affectent les couches de terrain de façon
différentes suivant la valeur de la friction de la faille
majeure. Seuls les modèles avec faille de socle expliquent
la présence de failles secondaires, concentrées
dans la zone au-dessus du point d'émergence de la rampe
(moitié Ouest de l'anticlinal). Ces résultats montrent
que l'hypothèse d'un pli de détachement est plausible.
L'examen des calculs de contrainte est fait en terme de régime
de contraintes (distribution du rapport de forme) et aussi en
terme de proximité à la rupture. Là aussi
des différences sont obtenues et indiquent des variations
du développement de la fracturation pour la couche réservoir
suivant les modèles proposés. La fracuration qui
serait induite par compression tectonique (dans les roches compétentes)
se propage latéralement suivants les limites stratigraphiques
à partir du point haut du pli. L'effet de contrainte de
flexure par amplification du pli peut être à l'origine
d'une fracturation intense et être lié aux conditions
de frottement le long de la faille de socle. La faible résistance
et la ductilité des argiles du Silurien peut conduire à
un découplage mécanique des formations au-dessus
et au-dessous. Ce découplage doit favoriser un glissement
banc sur banc avec les terrains sus-jacents et affecter la propagation
de failles secondaires avec réfraction aux interfaces.
Ce travail illustre le potentiel des modèles mécaniques
à tester des hypothèses sur la géométrie
des pièges structuraux et mieux comprendre le rôle
mécanique des failles et des propriétés des
sédiments. La modélisation reste qualitative en
raison des limitations inhérentes aux modélisations
a grande chelle (d'espace et de temps) mais une confrontation
avec les données géologiques et géophysiques
reste toujours possible. Ceci permettra de mieux cerner les principaux
paramètres et approfondir notre compréhension des
causes et effet du processus de fracturation et d'être prédictif
sur la distribution de la fracturation en relation avec la position
structurale et l'état de contrainte tectonique.
1. INTRODUCTION
The Ahnet Basin, central Algeria (Figure 1), is a large sedimentary
basin of major hydrocarbon recovery importance (Klemme and Ulmishek,
1991; Macgregor, 1996; Demaison and Huizinga, 1991; Tissot et
al., 1973; Chiarelli, 1978). The productivity of wells in
the Ahnet Basin, however, is very inconstant due to problems related
with natural fracturing of the reservoirs (Badsi, 1993). In particular,
the poor knowledge of the geometry and spatial distribution of
fractures disables the determination of zones of denser fracturing
and better connectivity to improve the development and production
of gas and oil fields. For instance, although the presence of
gas has been proven in the Garret El Gueffoul, a large anticlinal
structure in the central Ahnet Basin, only a few production wells
have been moderately successful. Posterior analysis of borehole
data confirms the role of reservoir fracturing on the (non)productivity
of the wells (Beicip-Sonatrach, 1993).

Figure 1. Hydrocarbon production in northern Africa. The Ahnet Basin, located in central Algeria, is shaded/Coloured (After Macgregor, 1996).
Obviously, a better knowledge of the tectonic history of the
Ahnet basin, the geometry and evolution of its internal structures,
the orientation of major (internal) faults, and the spatial distribution
of natural fracturing of reservoirs is of major importance for
the planning of new wells, for the calculation of hydrocarbon
reserves, and for the development of gas and oil fields. Knowledge
of fracturing parameters such as the orientation of fracture planes
or the extension of fractures zones can help to optimise the orientation
(deviations) of production wells. Also important is the determination
of the hydraulic properties of fractures from borehole data to
distinguish open fractures, which act as reservoir drains, and
closed fractures, which act as permeability barriers.
In this rapport we present the results of a finite element study,
carried out to improve our understanding of the temporal evolution
and spatial distribution of natural rock fracturing and stress
concentration in the Ahnet Basin in general and within the Garret
El Gueffoul anticline in particular. A numerical model has been
constructed from a two-dimensional composite present-day cross
section running east-west through the northern part of the Garret
El Gueffoul and based on surface geology, reflection seismic and
wellbore data. Numerical analyses include linear elastic as well
as non-linear elasto-plastic behaviour for the sedimentary rocks.
In addition, we investigated the influence of differential motion
along a listric basement fault, genetically related to the formation
of the anticlinal structure, on the spatial and temporal distribution
of rock failure within the Garret El Gueffoul.
2. THE AHNET BASIN, ALGERIA
2.1 Tectonic setting
The Ahnet Basin is a large intracratonic sedimentary basin of
Palaeozoic age (Boudjema, 1987), located in the central and southern
regions of the Algerian Sahara Massif (Figure 1). The Ahnet Basin
is situated in a tectonically stable region (Klitsch, 1970; Beuf
et al., 1971; Dixon and Robertson, 1984; Guiraud and Maurin,
1992), with the West-African craton extending westwards and the
cratonised mobile belts of the Hoggar towards the east and north.
South of the Ahnet Basin develops the Mole d'In Ouzzal, an also
very stable structure

Figure 2. Map of the neotectonic structure of the Ahnet Basin and its immediate surroundings. Three distinct, north-south running tectonic provinces can be recognised within the Ahnet Basin. The area in red in the central province is the Garret El Gueffoul anticlinal structure, which is the focus of interest in this study.
The Ahnet basin itself is bounded to the south-east by the Mole d'Arak and to the north-east by the Djebel Azaz, which separates it from another basin, the Mouydir Basin. The western limits are represented in the north by the Bled-El-Mass and in the south by the Tanezrouff, which is part of the Reggane Basin. Towards the north, the Palaeozoic sediments of the Ahnet Basin disappear against the Mesozoic sediments that cover the entire Ahnet Basin. The southern limit is characterised by outcrops of Infratassilian basement.
2.2 Stratigraphy
The stratigraphy of the Ahnet Basin (Boudjema, 1987; Klemme and
Ulmishek, 1991) is summarised in Figure 3.

Figure 3. Stratigraphy of the central province of the Ahnet Basin.
Precambrian basement
The contact between the Palaeozoic sediments of the Ahnet Basin and the underlying basement is formed by a major discordance. In Saharan basins and grabens, the basement below this discordance often consists of thick series of little or not metamorphosed Precambrian rocks, known as series pourpres (Beuf et al., 1971), which have mechanical properties substantially different from other basement rocks encountered in the Sahara.
Cambro-Ordovician
During the Cambro-Ordovician, a series of predominantly sandstones
(with a thickness of 560 metres at drill site GF3) has been deposited
discordantly on the Precambrian basement (Beicip-Sonatrach, 1970;
Beuf et al., 1971). These sandstones are the classic petroleum
reservoirs in the South-Algerian basins. Not so in the Ahnet Basin
where they are more compact and cemented than in the other basins,
and therefore since long have been considered of secondary importance.
Only natural fracturing of the sandstones can play an important
role in the improvement of the petrophysical features of this
reservoir.
The Cambro-Ordovician series is classically subdivided into three
units. The lowermost unit, Unit II, lying discordantly on the
Precambrian basement, consists mainly of course to conglomerate
(at the base) sandstones, deposited in a fluviatile environment.
Although this unit has never been considered a major petroleum
objective, the little available borehole data of this unit show
that its petrophysical characteristics, porosity particularly,
are often better than the other overlying Cambro-Ordovician reservoir
units. Its reservoir characteristic are even further improved
by the local occurrence of rock fracturing. The middle Cambro-Ordovician
unit, Unit III, is an alternation of shales and sandstones with
a quartzite layer in the middle. This unit is deposited in a mix
of an open marine and a large-scale transgressional environment.
Unit III can be further decomposed in three sub-units (Figure
3), but neither of these is considered or has proven to be a good
quality petroleum reservoir. Unit IV, the upper Cambro-Ordovicium
unit, is characterised by sandstone and quartzite facies, and
a typically glacial depositional environment. Within the Ahnet
Basin, the facies of Unit IV correspond with reservoir features
of medium to zero quality. Fracturing, however, may in certain
cases supply some permeability to this, originally compact unit.
Silurian
During the Silurian clay has been deposited in an open marine environment, producing a 430 to 800 metres thick layer of shales in the Ahnet Basin. Radioactive shales at the base of the Silurian have been widely recognised all over the Saharan Platform, and constitute an excellent stratigraphic correlator.
Devonian
The Devonian sedimentary sequence can be divided into eight units
(Figure 3) of predominantly of sandstones and shales, and with
a carbonate layer in the Middle Devonian.
The Gedinian (120 to 250 m) includes the Silurian-Devonian transition,
manifested by alternating layers of shales and sandstones, the
former deposited in a marine environment, the latter in a coastal
environment. The Siegenian (70 to 120 m) mainly contains fine
to medium quartzitic sandstones, deposited in a fluviatile environment,
with some shale layers announcing a marine facies. The Siegenian
is not a good quality reservoir: the sandstones are compacted
and although some near-vertical fissures have been reported, these
are hardly ever open to improve permeability. In contrast, the
Emsian (50 to 120 m) contains a good quality hydrocarbon reservoir
in its upper parts, characterised by mainly fine to medium, sometimes
even course to conglomeratic sandstones. The Lower Emsian consists
of silty shales with fine layers of sandstones and carbonates.
Substantial thickness variations of the reservoir sandstones are
observed locally.
The Couvinian (58 to 105 m) and Givetian (30 to 75 m), together
composing the Middle Devonian, are both deposited in a typically
marine environment. The Couvinian mainly consists of shales, locally
carbonated and sometime alternating with bands of sandstone. The
Givetian is constituted of compact carbonates with rare layers
of shale.
The Upper Devonian Frasnian (thickness less than 460 m) and Fammenian
(less than 1000 m) deposits are predominantly shale formations,
both also containing carbonate layers, in the former concentrated
in the base, while more evenly distributed in the latter. Finally,
the Strunian (less than 300 m) is characterised by an alternation
of fine to very fine silico-quartzitic sandstones and fossil-containing
shales.
Carboniferous
The Carboniferous deposits constitute the Upper Palaeozoic in
the Ahnet Basin, terminated by a major, Hercynian discordance.
Three distinguishable stratigraphic units of Carboniferous age
have been encountered in the Ahnet Basin, although the youngest
of these is eroded in most parts of the basin.
The Tournaisian (thickness maximally 300 m) is a shale-sandstone
unit altogether, but with a basement sandstone layer. This layer
constitutes a reservoir of good quality, but is rarely present
in the Ahnet Basin, being eroded by the Hercynian discordance.
The Visean unit (max. 300 m) is characterised by siliceous shales
with mica, fossils and pyrite, and by fine grained sandstones.
The series of the Namurian unit (max. 170 m) (not in Figure 3)
are deposited in a marine environment. They constitute shales
with some bands of sandstones and dolomites.
Mesozoic (not shown in Figure 3)
The Palaeozoic sediments of the Ahnet Basin are covered unconformably by a blanket of Mesozoic, mainly marine sediments with a thickness of 300 to 600 metres. The cover is constituted by shales and course sandstones with traces of dolomites.
2.3 Palaeo-structural history and present-day structure
The palaeo-structural history of the Ahnet Basin (Boudjema, 1987;
Klitsch, 1970; Guiraud and Maurin, 1992) is concisely illustrated
in Figure 4 by the structural evolution of an east-west cross
section, reconstructed from seismic sections and borehole data.

Figure 4. Schematic reconstruction of the Palaeostructure of the Ahnet Basin in an east-west running cross section. The reconstruction is based on surface geology, borehole data and seismic sections. The first order structural features of the Ahnet Basin, including the subdivision into three major tectonic provinces, have been formed during the Hercynian with little deformation afterwards. Note the substantial uplift of the eastern and western Ahnet provinces, thus distinguishing them from the central province. Also note the extensive distributed Hercynian faulting in the western Ahnet Province, as well as the intense localised faulting in the Garrett El Gueffoul anticline in the central Province.
At the end of the Middle Devonian (Figure 4a), the Cambro-Ordovician
and Silurian sedimentary deposits have only been weakly deformed.
Folding initiates around Late Devonian-Early Carboniferous (Figure
4b). During this early phase, the proto-Ahnet is divided into
three major, north-south elongated structural domains (Figure
2), of which the western domain is already being uplifted. Folding
and faulting intensifies during the Hercynian deformation (Biju-Duval
et al., 1966; Guiraud and Maurin, 1992), at the end of
which (Figure 4c) the first-order structure features of the Ahnet
Basin still present today have been formed. Three, clearly distinct
structural domains are recognisable in the Ahnet Basin (Boudjema,
1987). The eastern and western domains are more intensely deformed
and also have been subjected to more uplift and subsequent erosion
than the central domain. Figure 9d shows the present-day structure
of the Palaeozoic Ahnet Basin, covered by Mesozoic sediments.
All three domains of the Ahnet basin have been subjected to more,
although less intense, deformation throughout the Mesozoic and
Tertiary, as evidenced by observed mesoscale faults cutting and
displacing the Hercynian discordance, which forms the top of the
basin.
Seismic profiles and borehole data (Badsi, 1993; Aouine, 1990)
show that, in general, the faults are inverse, some of them having
offsets of more than 1000 metres. The Hercynian faults are often
found on the flanks of well-defined anticlines and run parallel
with the fold axis of these structures. Analysis of their orientations
indicate structures running predominantly NW-SE or NE-SW within
the Ahnet Basin. This bipolar distribution can be related with
the two known dominant stress directions (N40E and N120E) acting
during the Hercynian deformation (Boudjema, 1987).
In contrast to the well-defined Palaeozoic anticlinal structures,
less numerous but much vaster structures with less well defined
orientations are present in the Ahnet Basin, in particular in
the central domain.
2.4 Petroleum aspects of the Ahnet Basin
The source rocks of the Ahnet Basin are mainly the marine shales
of the Lower Silurian and of the Frasnian/Givetian (Figure 3)
(Boudjema, 1987; Klemme and Ulmishek, 1991, Macgregor, 1996).
Secondary sources may exist in the middle sections of the Silurian
and in the Cambro-Ordovician. The reservoir rocks of the Ahnet
Basin are mainly constituted by the sandstones of the Cambro-Ordovician
and Silurian (Figure 3) (Boudjema, 1987; Beicip-Sonatrach, 1971).
The sandstone layer within the Tournaisian of the Carboniferous
is also a good reservoir, but is often eroded in the Ahnet Basin.
The source rocks were matured by pre-Hercynian coverage, and
subjected to a maximal temperature of about 200 oC, as indicated
by fission track analysis (Beicip-Sonatrach, 1993). Geochemical
data suggest that the maximal generation of gas coincided with
the formation of the principal structures during the Hercynian
Orogeny. The gas was trapped in the Palaeozoic reservoirs of the
Ahnet Basin at the end of the Carboniferous. Most of the liquid
hydrocarbons were probably already expelled by the high maturation
temperatures before the major phases of Hercynian deformation.

Figure 5. Interpreted contour map of seismic isochrones (two-way travel time) towards top Ordovicium (the major reservoir unit) in the Garret El Gueffoul anticlinal/domal structure. Based on the orientation of interpreted faults, the dome can be subdivided into a northern and southern tectonic domain with faults running typically N-S and NW-SE, respectively. GF 1 to 4 indicate locations of production wells. Long, straight lines denote orientations of seismic reflection lines. The numerical analysis is carried out for the east-west running cross section running along seismic line 80GOU46B, which is shown in Figure 6.
The Garret El Gueffoul, a anticlinal structure of Hercynian origin,
constitutes a structural hydrocarbon trap in the northern part
of the Ahnet Basin (Figure 2). Figure 5 is an isochrone contour
map of the top Ordovician of the Garrett El Gueffoul, and also
shows locations of several boreholes and seismic reflection lines.
The east-west running seismic reflection line 80GOU46B (Figure
6) traverses the northern part of the Garret El Gueffoul, running
perpendicular to most of the mesoscale reverse faults. This
reflection line forms the basis of the numerical models.

Figure 6. Interpreted seismic reflection line (80GOU46B) running east-west through the Garret El Gueffoul dome (see inset upper left).
3. FINITE ELEMENT MODEL OF THE AHNET BASIN
3.1 Geometry
Primarily utilising the seismic section (Figure 6), but also
incorporating surface geology field data and correlating the available
borehole data, a first order composite cross section running east-west
through the northern part of the Garret El Gueffoul (Figure 7)
has been constructed. This composite model is used as the
starting-point to build a two-dimensional finite element model
(figure 8) which can be used to compute the deformations and stresses
in the Ahnet Basin.


Figure 7. First order composite model of an east-west running cross section through the Garret El Gueffoul dome. The model is based on seismic reflection data (Figure 6), surface geology field data, and correlation of borehole data.
An extensive and comprehensive description of the finite element
method is given by Zienkiewicz and Taylor (1988, 1989). The finite
element code used for the calculations is Tecton (Melosh and Raefsky,
1980), an originally elasto-viscous program, which has the ability
to incorporate pre-existing faults in meshes (Melosh and Raefsky,
1981; Melosh and Williams, 1987), and which has been modified
to also carry out elasto-plastic analyses and to handle friction
on faults (Beekman, 1994; Van Wees, 1994).


Figure 8. Two-dimensional, plane-strain finite element model based on the composite model displayed in Figure 7. The red dots denote the discrete points along which differential motion (= fault slip) is possible. Note that the different coloured hanging wall and foot wall are the same sandstone.
The boundaries of the finite element mesh are best to be placed far away from the region of interest in order to avoid unwanted interference from numerical problems occurring at the mesh boundaries (a "typical" problem when using the finite element method). Tests with several meshes of different sizes showed that at a model with spatial dimensions of at least 100 km length by 40 km depth is required. To avoid a substantial increase in the number of elements, and thus in computation time, the size of the elements is increased away from the region of interest. In the pre-processing phase of the construction of the final mesh (Figure 8), "element size" contour lines have been used, reducing the typical size of the triangular elements from 2000 metres at the lower and vertical edges to a mere 100 metres in the central section This has led to a total of almost 30,000 elements and 15,000 nodes. The used elements are 3-node, isoparametric triangles, with linear shape functions and therefore constant strain and stress.
3.2 Boundary and loading conditions
The present-day intraplate stress field in the northern part
of the African plate is most likely generated to a first order
by active plate boundary processes connected with the on-going
inter-plate N-S convergence between the African and European plates
(Zoback, 1992). As a result, the intraplate stress field in northern
Africa, including Algeria, is uniformly oriented over wide areas,
with a NNW-SSE direction of the maximum horizontal compression.
Consequently, the Ahnet Basin has been and still is subjected
to some horizontal compression. Unfortunately, the history of
the stress loading and magnitude of compression are not well known.
On the other hand, the numerical models analysed in this study
are based on the present-day geometry, and it would therefore
be unrealistic to subject the model to loading over a longer period
as the geometry of the basin, and with that the distribution of
stresses and strains, would certainly be affected it. Evidently,
the model must not be deformed to much, to allow a valid interpretation
of the results for the present-day situation of the Ahnet Basin.
All models of the Ahnet Basin investigated in this study can
be divided into two major types: models without and models with
a listric basement fault. There is no direct evidence for the
existence of such a basement fault. Its possible presence has
been investigated nevertheless, as such faults are often genetically
linked with anticlinal structures similar to the Garret El Gueffoul.
Figure 9b illustrates the boundary and loading conditions for
the Ahnet model without basement fault. The upper surface is free
to move horizontally and vertically, which, in general, is true
for all models. The lower basement limit, at a depth of 40 km,
is restricted to move vertically, but allowed to move horizontally.
The latter is required to accomodate the horizontal displacements
due to the velocity loading applied at both vertical edges in
inward direction. (Note that the elastic and plastic deformation
processes in the numerical model are essentially time-independent,
and that, therefore, the entire analysis is quasi-static. The
use of terms like "velocities" and "time periods"
merely serves to conveniently describe the progress in horizontal
displacement of the vertical edge(s)) The rate of the applied
horizontal shortening is 3.171 10-11 m.s-1, which is equivalent
to 1 km/Myr-1. This velocity, distributed over the two vertical
edges, is applied for a maximal time period of 0.5 Myr, thus for
a total horizontal shortening of 0.5 km. This means that the entire
model, which has an initial length of 100 km, is shortened maximally
by 0.5%. This low value of maximal strain satisfies the demand
that the Ahnet model is not allowed to deform substantially.

Figure 9. Schematic illustration of the boundary and loading conditions of the numerical models of the Ahnet Basin investigated in this study. The boundary conditions displayed in panel a serve to calculate the initial, gravitationally derived stresses.
Figures 9c and 9d display the boundary and loading conditions
for the two investigated Ahnet models with listric basement fault.
The conditions for the first (Figure 9c) of these two fault models
are similar to the conditions of the unfaulted Ahnet model, except
that for numerical reasons the termination of the basement fault
at the eastern edge is left free, that is, no velocity is applied
to this point. This model of the Ahnet Basin represents a situation
of an old, pre-existing basement fault which may or may not be
(partially) reactivated under more recent compressional loading.
In contrast, in the second fault model (Figure 9d) differential
motion over the basement fault (which has no friction on its horizontal
segment) is enforced by applying a convergent velocity only to
the hanging wall block, while rigidly fixing the foot wall in
horizontal direction. This situation is perhaps more representative
for the formation of the Garret El Gueffoul anticline in the Precambrian
(Biju-Duval et al., 1966), and less representative for
the more recent Cenozoic compressional deformation (Klitsch, 1970).
Gravitational body force loading
All models are also subjected to gravitational body force loading, which is applied at the very first solution step at time zero. Besides a gravitationally induced stress field (Goodacre and Hasegawa, 1980; Sonder, 1990), the initial body force loading also produces undesired displacements (Figure 10a) within the models due to gravitational self-contraction (Geller, 1988). This "artificial" effect is corrected by first, in a single elastic solution step, computing the gravitational stresses for an Ahnet model without fault and with boundary conditions as displayed in Figure 9a. These gravitational stresses are saved in an external file, and subsequently reloaded in the full Ahnet models as initial stresses with inverted sign (the initial stresses are not added to the total stresses). The equivalent internal forces derived from these initial stresses will balance, theoretically, the gravitational body forces, and consequently not produce any displacement.

Figure 10. (a) Vertical displacements (hundreds of metres) due to gravitational body force loading. (b) Vertical displacements after "inverted" initial stress loading has been included to counterbalance the undesired gravitonic displacements. Remaining non-zero displacements are less then 10-5 m. (c) Same as (b), but for a model with a frictionless basement fault included. Although the gravitonic balancing is less successful, residual displacements (< 1 m) are still negligibly small compared to the gravitationally induced displacements (panel a).
This approach is numerically succesfull, as demonstrated in Figure
10b which displays the vertical displacements after an elastic
solution run within an initially stress-loaded Ahnet model. The
net displacements are zero throughout the model, except in the
top of the Garret El Gueffoul fold structure. Displacements here,
however, are in the order of 10-5 m, negligably small compared
with the structural displacements (order 100 to 103 m) computed
for the several Ahnet model without basement fault in this study.
The displacement balancing is less effective for Ahnet models
with basement fault, as illustrated in Figure 10c. Due to the
gravitational stresses, the fault may be unlocked locally, and
fault slip may occur in response to any net force present in the
model (such as demonstrated in Figure 10b). This results in initial
displacements in the order of 10-1 to 100 m in the Ahnet models
with basement fault. It is not clear in how far these initial
displacements, although still small, will affect the structural
solutions within these Ahnet models.
3.3 Material properties
The model of the Garret El Gueffoul consists of five Palaeozoic
sedimentary layers (Figure 8), lying on top of a Precambrian sandstone
basement and covered by Mesozoic carbonates. The Palaeozoic series
consists, from bottom to top, of: (5) a Cambro-Ordovician layer
of predominantly sandstones; (4) a thick layer of Silurian shales;
followed by (3) a Lower and Middle Devonian layer with alternating
sandstones and shales, and a distinct unit of condensed carbonates
in the top; which is overlaid by (2), a layer of predominantly
sandstone from the Frasnian; and finally (1), the alternating
sequences of sandstones and shales from the Upper Devonian Fammenian
and Strunian series.
The material properties of the sedimentary layers and basement
incorporated in the numerical model are listed in Table 1. All
properties, except the cohesion, are measured directly from borehole
rock samples.
Table 1. Material properties


Stratigraphic unit        Lithology        Density   Young's  Poisson's Cohesion friction
                                           (kg.m-3)  modulus    ratio     (Mpa)   angle
                                                      (GPa)

Fammenian/Strunian        shales/sandstone   2500     27.5      0.20      2/20     31

Frasnian                  sandstone          2480     27.5      0.25      3/30     33

Lower/Middle Devonian     sandstone/shales   2500     27.5      0.20      2/20     31

Silurian                  shales             2530     27.0      0.15      1/10     10

Cambro-Ordovician         sandstone          2480     28.0      0.25      3/30     30

Precambrian               sandstone          2480     28.0      0.25      5/50     50

basement                  sandstone          2480     28.0      0.25      5/50     50
No data are available for the cohesion of the sediments and basement in the Ahnet Basin. We, therefore, assumed two series of rock cohesion values which differ one order of magnitude, thus defining a lower and upper bound, and which approximately reflect the relative rock cohesions between the different lithologies (Carmichael, 1989).
3.4 Stress-strain relationships
In the most general description of perfect elasticity the components of strain at any point within an elastic medium are homogeneous linear functions of the components of stress, and are described, therefore, by
 | (3.1) |
This is the most general expression of Hooke's law, which can be reduced into a simpler form knowing that both ij and kl are symmetric tensors, knowing that there is no dissipation of elastic energy, and assuming isotropic behaviour:
 | (3.2) |
where ij is the Kronecker delta, and lambda and mu are two elastic parameters (called Lamé's constants). Equation (3.2) gives the stresses in terms of the strains for an isotropic elastic medium. By setting i=j in equation (3.2) and carrying out the summation, one gets
 |
which can be rewritten, using the expressions for the "mean normal stress" (0=1/3ii) and the "cubical dilatation" (=xx+yy+zz), as
 |
or, when defining +2/3=K, as
 | (3.3) |
Equation (3.3) gives the relation between mean normal stress and
volumetric deformation (cubical dilatation). The parameter K,
called the "incompressibility" or "bulk
modulus", can be seen to be the ratio between mean normal
stress and cubical dilatation, i.e. the inverse of the compressibility.
The Lamé parameter is usually known as the "shear
modulus".
Equation (3.2) can be rewritten, using equation (3.3), to give
the strains in terms of the stresses:
 | (3.4) |
Defining two further elastic parameters, the Young's modulus E and the Poisson ratio , as, respectively,
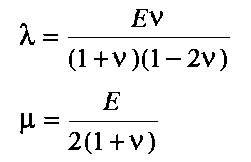 | (3.5) |
then E and are related with Lamé's constants through
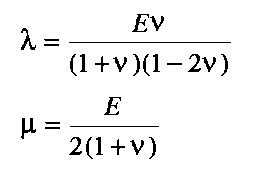 | (3.6) |
Of the five elastic parameters , , K, E, and , only
two are independent.
Using equations (3.6), equation (3.2) can be rewritten in terms
of E and as follows:
 | (3.7) |
This is the most used form of Hooke's law for isotropic elastic
media. From (3.4) it becomes immediately clear that the principal
axes of strain and the principal axes of stress coincide.
In the finite element models of the Ahnet Basin the internal
deformation occurs plane-strain in the x-y plane, thus zz=0 (and
also xz=yz=0 and xz=yz=0 (Love, 1944; Timoshenko and Woinowsky-Krieger,
1959)). Substituting this in equation (3.7) gives the strain-stress
relationships for plane-strain deformation:
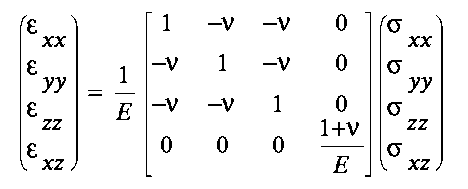 | (3.8) |
This system of equations can be inverted to obtain the stress as a function of strain:
 | (3.9) |
Inserting the condition zz=0 reduces equation (3.8) to
 | (3.10a) |
 | (3.10b) |
Equations (3.10) give the stress-strain relationships for the plane-strain problems analysed in this study.
3.5 Rock failure criterion
For rocks possessing both frictional and cohesive components of shear strength, the best known failure criterion is that due to Mohr-Coulomb (Jaeger and Cook, 1976; Scholz, 1990). This empirical criterion for brittle shear failure states that fracturing occurs across the plane (or planes) where the shear stress first reaches a value, the brittle yield stress, that depends on material parameters and on the normal stress n on that plane. Assuming compressive stresses to be negative (engineering sign convention, which is opposite to the geological sign convention), the Mohr-Coulomb criterion can be written explicitly in the form
 | (3.11) |
where S is the cohesive strength, the internal friction,
and the angle of internal friction of the faulted material. As
the sign of the shear stress does not affect fracturing, its absolute
value is used. The cohesive strength may be regarded as the inherent
strength of the material, or the shear stress required for fracture
when n=0. The internal friction is an empirical measure
of the increase in fracture strength brought about by the increase
in normal stress. The Mohr-Coulomb shear failure criterion is
expressed in Mohr stress space (,n) by two straight lines
intersecting the -axis at S, and with slopes =tan.
The orientation of the fracture planes can be determined graphically:
their normal make an angle of =/4+/2 to the direction of
maximum compressive stress.
From the Mohr's circle (Figure 10), the Mohr-Coulomb criterion
can be formulated as full three-dimensional plasticity yield criterion
expressed in terms of principal stresses. Recalling that compressive
stresses are negative, the resolved principal stresses are ordered
so that 1<2<3, and thus that 1
is the major principal compressive stress. The Mohr-Coulomb yield
criterion thus becomes
 | (3.12) |
Shear yielding occurs if F<0; in this case plastic flow
is allowed in order to restore the condition F=0. The cohesion
S and angle of friction may depend on some strain hardening
or softening parameter, although in this study neither hardening
nor softening is considered.
The invariant form of the Mohr-Coulomb shear failure criterion
is given by
 | (3.13) |
Here, the stress invariants mean stress m, effective stress , and Lode angle are defined as
 |
 | (3.14) |
 |
where
 |
and
 |
, etcetera conform the expressions for the deviatoric stresses. The relationships between principal stresses and stress invariants, used to derived eqn (3.13) from eqn (3.12), are given by
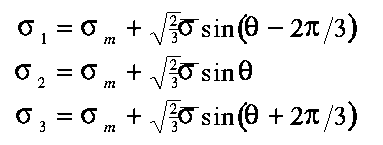 | (3.15) |
2 is not taken into account in the Mohr-Coulomb criterion. The distance from the origin to the plane in which the stress point lies (Figure 11) is given by , whereas the perpendicular distance of the stress point from the space diagonal is represented by . The Lode angle is a measure of the angular position of the stress point within the plane.

Figure 11. Mohr-Coulomb criterion for shear failure displayed in three-dimensional principal stress space (compression is negative) and in the -plane.
The above expressions for the Mohr-Coulomb criterion and stress
invariants are valid for the general, three-dimensional case.
In this study, however, two-dimensional plane-strain models are
used, which have a three-dimensional state of stress in which
the out-of-plane stress, zz, is identical to one of the
three principal stresses. There are three cases that are recognised:
zz is the (1) major principal stress; (2) minor principal
stress; or (3) intermediate principal stress. Assuming, conform
the plane-strain principle, that only in-plane yielding occurs,
zz has to correspond with the intermediate principal stress,
2, since the Mohr-Coulomb criterion (2) does not depend
on this principal stress. This is a reasonable assumption for
geologic situations, in particular when dealing with more competent
rocks like sandstones and carbonates. For incompetent rocks, like
shales, the assumption of only in-plane plastic deformation is
probably not valid. But for such "weak" materials it
is questionable if they yield according to the brittle Mohr-Coulomb
criterion at all. Geological observations show that faults not
well develop in shales, but that, instead, deformation is accomodated
by ductile flow. For such deformation, the Drucker-Prager yield
criterion may be more useful (which, however, is not implemented
in the finite element code Tecton).
The above assumption substantially simplies the yield equations,
and avoids the problem of singular points on the yield surface
in three dimensions (the Lode angle has become zero). The Mohr-Coulomb
criterion (3.12) reduces to the two-dimensional, in-plane version
(Figure 12)
 | (3.16) |
where , and where 1 is the major principal compressive stress and 2 the minor principal compressive stress, both in the plane of the model.

Figure 12. Two-dimensional version of the Mohr-Coulomb criterion, displayed in a Mohr's diagram.
3.6 Plastic flow
Once a yield criterion is satisfied, plastic (irrecoverable, by definition) deformation will occur. To derive expressions for the plastic strain increments, it is assumed that the elastic stress increments have been computed, and that the principal axes of both plastic and elastic strain increment are taken to be coaxial with the principal axes of stress (which is only valid if elastic shear strains are small compared to plastic strains). The overall strain increments of an element can be decomposed into elastic and plastic plastic parts:
 | (3.17) |
The plastic strain increments can be separated into "plastic shear" and "plastic volume" contributions. In this study we only considered plastic shear yielding resulting from satisfying the Mohr-Coulomb criterion for shear failure, and not included volumetric yielding. Furthermore, for perfect plasticity in the absence of hardening of softening it is assumed that once a stress state reaches a failure surface, subsequent changes in stress may shift the stress state to a different position on the failure surface, but not outside it; thus
 | (3.18) |
Allowing for the possibility of non-associated flow, plastic strain increments occur normal to a plastic potential surface Q. This, then, defines the plastic flow rule
 | (3.19) |
The flow rule for plastic shear yielding generally is non-associated, with the plastic potential for shear yielding given by
 | (3.20) |
where
 |
, and is the dilatation angle.
Differentiating eqs. (3.16) and (3.20) with respect to i,
and substituting in eqs. (3.19) and (3.17),
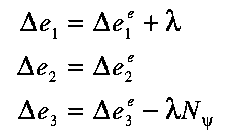 | (3.21) |
The stress increments are related to the elastic strain increments by the elasticity equations (3.10):
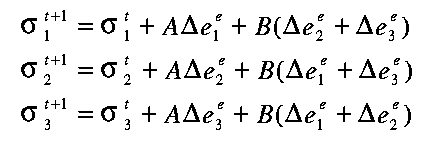 | (3.22) |
where and (see eqs. (3.2) and (3.3)). The initial estimates of the new stresses (before testing for yield) were also derived from the applied strain increments and the same elasticity relations:
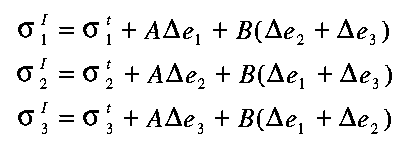 | (3.23) |
Substituting from eqn. (3.21) into (3.22) and then for from eqn. (3.23), we obtain, after some rearrangement,
 | (3.24) |
If shear yielding occurs, the final stresses must lie on the shear yield surface, i.e. F=0. Substituting eqn. (3.24) into the Mohr-Coulomb criterion (3.16) and solving for the plastic multiplier ,
 | (3.25) |
in which stands for the Mohr-Coulomb yield function evaluated for the initial trial stresses . Equation (3.25) can be used in eqn. (3.24) to compute the new stresses, and in eqs. (3.21) and (3.17) to compute the plastic strains.
3.7 Fault friction
For the model with basement fault, there is an additional parameter, the fault's friction, which has been varied between several study cases. The locking and unlocking of the pre-existing fault is controlled by locally testing the frictional law (Sibson, 1974)
 | (3.26) |
with S0 the cohesion of the contact surface and 0
the coefficient of friction. Although the form of equation (6)
is identical to the Mohr-Coulomb failure criterion, eqn(1), its
physical meaning is not the same. The failure criterion refers
to formation of a fracture plane, while the law of friction refers
to sliding along a pre-existing surface. The frictional parameters
S0 and 0 are not therefore necessarily the same
at the material parameters S and . While the values of
and 0 are in the same range, S > S0 by
one order of magnitude or more.
Friction is a consequence of the presence of asperities on the
surface along which sliding takes place. The coefficient of friction
and the cohesion are therefore affected by surface conditions,
and by the wear and gouge formation resulting from the sliding
process itself. The presence of water, and consequently of fluid
pressure, along the surface of sliding decreases the effective
normal stress across the surface and therefore the shear stress
required for sliding. For the Ahnet Basin, there are no data available
for either the fluid pressure, or the cohesion and friction on
a, perhaps pre-existing, listric basement fault in the Ahnet Basin.
Therefore, and because we were especially interested in the different
stress, strain and fracturing distributions which would be generated
by a fault model without friction and one with friction, we have
set the cohesion to zero and have adopted "trial" values
for the fault friction of 0 and 0.1, the latter being sufficiently
small to at least ensure some reactivation of the fault under
increasing convergence.
Elastic as well elasto-plastic plane-strain calculations have
been carried out for both models. Solutions have been calculated
for selected time steps up to a 1 Myr of convergence, equivalent
with 1 km of convergence of the velocity loaded model edge. In
the elasto-plastic models, the shortening is applied in small
incremental steps to closely track the load-history dependent
plastic strains and to gain a better convergence behaviour in
the non-linear models. For the same reason, ten initial iterations
at time zero are carried out for the elasto-plastic models when
gravitationally loaded.
4. AHNET MODEL WITHOUT FAULT
The configuration of this Ahnet model is displayed in Figure 13 (same as panel b in Figure 9). For this model, both a linear elastic and a non-linear elasto-plastic analysis are carried out in order to illustrate the substantial differences in the stress and strain distribution within the model obtained from these two different types of numerical analysis.

Figure 13. Schematic illustration of the boundary and loading conditions of the model of the Ahnet Basin without basement fault. For this model, both a linear elastic and a non-linear elasto-plastic analyses are carried out.
The elasto-plastic analysis is carried out for two different material models, one with a low, the other with a high rock cohesion (see Table 1). These two models hereafter will be referred to as the "weak" and as the "strong" model. The different values for the cohesion, of course, play no role in the elastic analysis where, by definition, rock failure is not included.
4.1. Linear elastic analysis
4.1.1. Displacements
Plots of the cumulative vertical and horizontal displacements (Figures 14 and 15) demonstrate that the (elastic) deformation of the Garret is characterised by and a vertical flexural amplification of the initial anticlinal structure and by a horizontal shortening (of course, due to the velocity boundary condition). The rate of uplift is constant throughout the model, with a maximum value c. 130 m/Myr at the top of the anticline.The horizontal displacements shows a slightly dispersive pattern in the region of the anticline. This also reflects the flexural enhanced uplift of the initial fold structure.

Figure 14. Colour contour images of the cumulative vertical displacements within the central section (which includes the Garret El Gueffoul anticline) of the elastic Ahnet model without listric basement fault. In this and all following similar figures, the top panel always shows the distribution due to gravitational body force loading only. Subsequent panels display the distribution after 100, 200, 300, 400 and 500 metres of applied horizontal shortening (rate is 100 m/0.1 Myr). Sign convention for vertical and horizontal displacements: upwards and eastwards is positive; downwards and westwards is negative.

Figure 15. Colour contour images of the cumulative horizontal displacements within the central section (which includes the Garret El Gueffoul anticline) of the elastic Ahnet model without basement fault.
4.1.2. Differential stress 1-3
The Silurian shale layer is prominently present on plots of the differential stress 1-3 distribution (Figure 16). At time zero, after gravitational loading, 1-3 increases roughly linear with depth with a gradient of c. 15 MPa/km, starting with zero magnitude at the model's surface. However, the course with depth of the differential stress is not continuous: there is a jump in magnitude at each sedimentary interface. Furthermore, the stress gradient differs within each sedimentary layer. These changes in differential stress are largest within the Silurian shale layer and at its interfaces with the underlying Cambro-Ordovician sandstone and the overlying Devonian sandstone/shale layers, and become more prominant when these layers are at greater depth, east and west of the anticline.

Figure 16. Colour contour images of the differential stress, 1-3, in the elastic Ahnet model without basement fault.
This discontinuous behaviour of the differential stress is the result of the different material properties (Table 1) of the sedimentary layers in the Ahnet model. This is explained by sketch 1. This sketch shows the course with depth of the vertical stress z and the horizontal stress x while passing a sedimentary layer, in this case the Silurian shale layer (in between the thick horizontal lines). Assuming the shear stress to be zero or negligibly small gives the the principal stresses: 1=z and 3=z. The horizontal distance between the two curves is thus a measure for the differential stress 1-3.
Sketch 1.
Since the sketch shows the stresses due to gravitational loading
only, the vertical stress is given by . The gradient of z is controlled
by the density, and is, therefore, steepest in the shale layer
(Table 1). The horizontal stress is obtained from the vertical
stress by multiplication with the factor . This factor, while
being constant within each layer, differs between layers and is
thus responsible for the discontinuous character of x (sketch
1), and therefore also of 1-3. The rate of change of the differential
stress with depth can be found from the following expression:
. This expression shows that it is the product of the pre-integral
factor and the density that controls the depth gradient of the
differential stress within each layer. In the Ahnet models this
product is largest for the Silurian shale and lowest for the sandstone
layers, which is clearly reflected in the lower three panels of
Figure 16.
The level of zero differential stress, at time=0 positioned at
the plate's surface, starts to migrate downwards under increasing
shortening (Figure 16). This behaviour is explained in the following
sketch
Sketch 2.
The left sketch shows the stresses due to gravitational body force
loading only: both x and z increase linearly with depth, and 1=z
and 3=x. Both stresses remain constant through time. The
second sketch shows x and y at an arbitrary time
t due to horizontal shortening only: both stresses are
constant with depth, and 1=x and 3=z. Both stresses
will increase in time under increasing shortening, but the ratio
between the two will remain the same. The third sketch shows the
combined state of stress at the arbitrary time t. The horizontal
distance between the two curves is the differential principal
stress 1-3, which is zero at the cross section of both
curves. Across this depth, the principal stresses undergo a 90o
rotation: at shallower depths 1 is horizontal, at greater
depths 1 is vertical. This turning point moves downwards
in time under increasing horizontal shortening/compression.
A particular phenomenon is the appearance, after 0.2 Myr of shortening,
of a local stress maximum at the western surface termination of
the Garret El Gueffoul (Figure 16). It suggests the onset of kinking
of the anticlinal structure around this point, thereby amplyfing
the initial fold structure. The associated concentration of the
differential stress, with a magnitude rising above 100 MPa, may
produce intense local deformation, such as fracturing, or initiate
faulting.
4.1.3. Principal stress ratio
The principal stress ratio R, defined as , in combination with the principal stress directions, gives an indication of the state of stress and, thereby, of the type of faulting that occurs in the case some brittle failure criterion is satisfied (Sassi and Faure, 199?). The three possible states of stress are identified depending on the relative magnitude of the most vertical principal stress. The state of stress is compressional (thrust faulting) when this principal stress is the smallest of the three principal stresses, strike-slip (strike-slip faulting) when it is the intermediate principal stress, and tensile (normal faulting) when it is the largest principal stress. For each of these three states of stress, the value of R runs between 0 and 1. Based on the exact value of R, a sub-division of the state of stress is possible, which describes more precisely the type of faulting which may occur. For instance, when in the compressional state of stress and 0.75<R<1 (Figure 17, orange segment), this implies that thrust faulting with a, more or less substantial, strike-slip component in the slip vector may occur.

Figure 17. Colour contour images of the principal stress ratio R, defined as , in the elastic Ahnet model without basement fault. This parameter gives, in combination with the principal stress directions, an indication of the state of stress and, thereby, of the type of faulting that occurs in the case some brittle failure criterion is satisfied.
When applied to the Ahnet model (Figure 17), the top panel shows that, as a result of gravitational loading, almost the entire model is in a tensile state of stress, thus implying normal faulting to occur when rock fails. When, subsequently, the Ahnet model is subjected to horizontal shortening, a compressive state of stress develops at the model's surface and, in time, expands downwards. Between this top compressional zone and the deeper parts of the model which remain in a tensile state of stress, there is a transitional zone characterised by a strike-slip state of stress. This zone moves downwards, while expanding in width at the same time. The distribution of the stress parameter clearly reflects the anticline of the Garret El Gueffoul, thus demonstrating the influence of the geometrical distribution of different materials on the magnitude and direction of the principal stresses. This is especially true for the Silurian shale layer which tends to remain in a strike-slip state of stress, while the overlying sandstone/shale and underlying sandstone layer move into a compressional state of stress. This may be of major importance when considering the occurrence of natural fracturing in these layers.
4.2. Non-linear elasto-plastic analysis
4.2.1 Effective plastic strain
The spatial distribution and evolution of the cumulative effective plastic strain in the "weak" (Figure 18a) and "strong" (Figure 18b) elasto-plastic models of the Ahnet Basin is similar, although occurs at a faster rate in the weak model. For instance, the distribution in the strong model after 0.5 Myr is comparable to the distribution in the weak model between 0.1 and 0.2 Myr of shortening.
| A) | B) | |
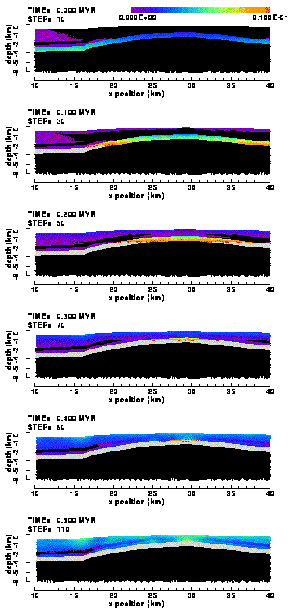 | 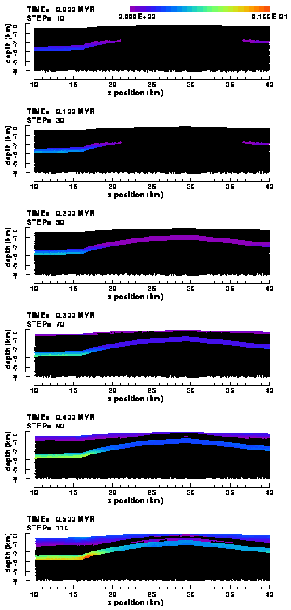 |
Figure 18. Colour contour images of the accumulated effective plastic strain in the (a) "weak" and (b) "strong" elasto-plastic model of the Ahnet Basin without basement fault. "Weak" and "strong" refer to models with low and high cohesion values, respectively. Black elements have not been in yielding yet; in grey coloured elements the plastic strain is larger than the upper contouring limit.
Both figures indicate that the Silurian shale layer is the weakest
sedimentary layer in the Ahnet Basin. Although under compressional
loading parts of the shallower layers also have undergone plastic
deformation, most of it occurs in the shale layer. The intensity
of plastic deformation varies smoothly within the shale layer
and, in general, increases with global depth. Some plastic strain
localisation occurs within the Silurian shale at the western termination
of the anticline (Figure 18b). In the weak model, this is accompanied
by near-surface strain localisation, although less intense. This
model furthermore exhibits more concentrated yielding in the crest
of the anticline in a zone which expands upwards from the shale
layer.
In the numerical calculations, rock failure is always simulated
by plastic deformation. Based on the geological knowledge of the
deformation processes involved with failure of different types
of rocks, the occurrence of "numerical" plastic deformation
in the models can be interpreted either as brittle fracturing
or as plastic flow. For instance, the Silurian shale layer in
the Ahnet Basin can be expected to deform by plastic flow when
yielding. The other layers, consisting of sandstones or sandstones/shales,
are more likely to deform in a brittle way under yielding. In
the latter case, "brittle" yielding can be interpreted
as faulting when the associated plastic straining is intense and
highly localised in ductile shear zones, or as natural fracturing
when the plastic straining is less intense and more distributed.
Applying these concepts to the results displayed in Figure 18,
suggests that the Silurian shale layer is already deforming by
plastic flow under relative little loading. The strain localisation
developing under enhanced loading may indicate the formation of
a fault or fault zone, which perhaps may cut and offsett the layer
in a later phase. In the more competent layers of the Ahnet Basin,
distributed fracturing starts at near-surface depths over the
whole width of the basin, and subsequently expands downwards.
At the same time, fracturing develops in the crest of the Garret
El Gueffoul anticline, particularly in the sandstone/shale layers.
Under enhanced compression, this fracturing zone propagates slowly
in horizontal as well as vertical direction.
4.2.2. Proximity to failure
The prospect on natural fracturing, an important parameter in this study, is illustrated by plots (Figure 19) of the proximity-to-failure of the rocks for both the weak and strong Ahnet model. The proximity-to-failure is defined as the ratio between the effective stress and the failure stress. If the ratio is one, the effective stress has reached the yield limit and rock failure occurs. Due to local strain redistribution (like fault slip), the effective stress may relax and descend below the yield limit (ratio<1), thus bringing the rock out of failure. On-going model loading will increase the effective stress again and bring it back to the yield limit ("stick-slip" like behaviour).
| A) | B) | |
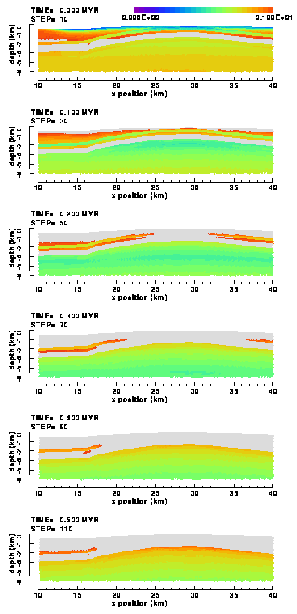 | 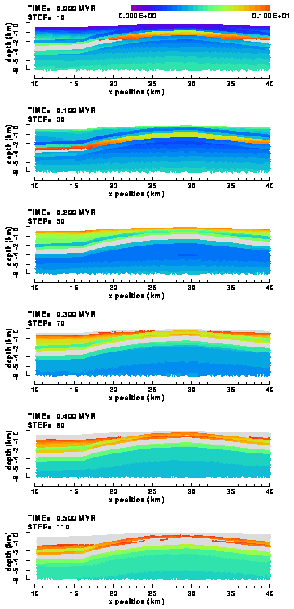 |
Figure 19. Colour contour images of the proximity-to-failure distribution in the (a) "weak" and (b) "strong" elasto-plastic model of the Ahnet Basin without basement fault. The proximity-to-failure is the ratio between effective stress and failure stress. Where the ratio is one (grey coloured elements), rock is failing, whether by brittle fracturing or by ductile flow. The bizarre row of triangular elements appearing at a depth of 4.5 km in the westernmost part of the panels (and also in other figures) is the result of a bug in the plotting software.
The distribution of the grey elements (failure proximity = 1, thus were yielding takes place) in Figure 19 reflects the distribution of the plastic strain (Figure 18). Figure 19 shows in addition that both the Devonian sandstone/shale layers are also prone to failure, in particular when compared to the Cambro-Ordivician and Devonian sandstone layers. In both models, fracturing during the first 0.5 Myr of compression occurs only in the sedimentary layers above the Silurain shale layer. The Cambro-Ordivician sandstone layer, a potential reservoir, below the shale remains unfractured for the time being.
4.2.3. Differential stress
In the early phases of compression, the distribution of differential stress (Figure 20) in both the weak and strong Ahnet model is similar to the elastic solution (Figure 16) and conform sketch 1: the differential stress increases with depth, but is discontinuous across sedimentary layer interfaces due to differences in the material properties. The solutions start to differ after 0.1 Myr of compression, particularly in the sedimentary layers above the Silurian shale layer. There, the magnitudes of the differential stresses remain low in the weak model, less than 50 MPa, whereas they continue to increase in the strong model, reaching values in excess of 100 MPa. The stress level in the Silurian shale layer, the weakest of all layers, does not exceed a value of c. 25 MPa in the weak model and c. 50 MPa in the strong model (Figure 20). These differences between the two investigated models are due to differences in yield stresses, which, obviously, is the result of the one order magnitude differences in rock cohesion values between the two models
| A) | B) | |
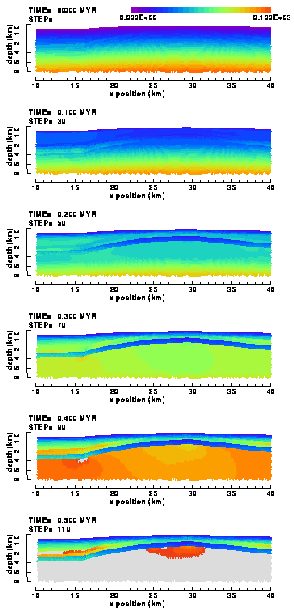 | 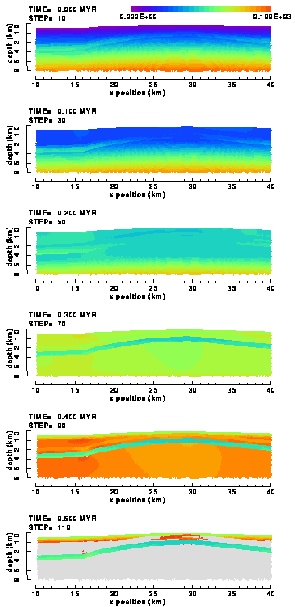 |
Figure 20. Colour contour images of the differential stress, 1-3, distribution in the (a) "weak" and (b) "strong" elasto-plastic model of the Ahnet Basin without basement fault. In grey coloured elements the stress magnitude exceeds the upper contouring limit (100 MPa).
4.2.4 Principal stress ratio
The distribution of the principal stress ratio R in the elasto-plastic strong Ahnet model (Figure 21b) is almost similar to the distribution of the elastic Ahnet model (Figure 17). In the weak model (Figure 21a), the value of R in the Silurian shale layer rapidly descends to zero within the tensile/strike-slip state of stress domain, while clearly residing in the strike-slip domain for the strong model. Another striking difference between the two models is the propagation of the regions in a compressional state of stress. In the strong model this occurs in downward direction over the entire width of the model. In the weak model, however, only the uppermost few hundreds of metres are brought into a modelwide compressional state of stress, and, furthermore, only in both the sandstone layers. In these layers, the change from a strike-slip into a compressional state of stress typically starts in the crest of the anticline and subsequently propagates in sidewards directions (Figure 21a).
| A) | B) | |
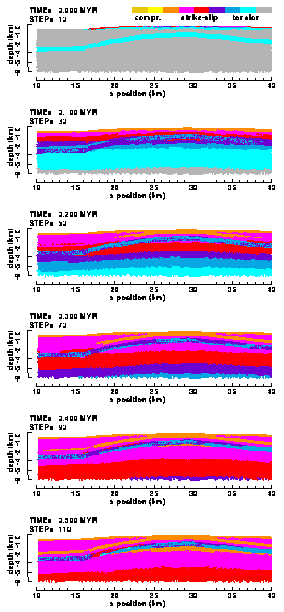 | 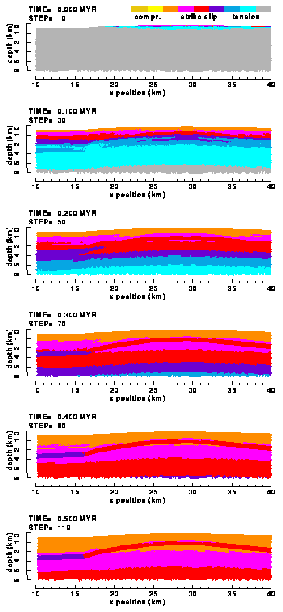 |
Figure 21. Colour contour images of the principal stress ratio R in the (a) "weak" and (b) "strong" elasto-plastic model of the Ahnet Basin without basement fault.
Figures 21 are best to be combined with the figures displaying the proximity-to-failure distributions in order to make predictions on where in which layer what type of fracturing might occur. As discussed before, plastic deformation in the shale layer is assumed to take place by ductile flow. When interpreting, for instance, the failure-proximity and R panels at time=0.2 Myr for the weak Ahnet model (Figures 19a and 21a), distributed brittle deformation takes place over the entire width of the model, but only in the uppermost kilometre of the Upper-Devonian sandstone/shale layer. However, brittle deformation occurs in the other Palaeozoic layers, but only regionally in the crest of the Garret El Gueffoul anticline. And whereas the fracturing is clearly compressional (thrusting) in the pure sandstone layers, it can be both compressional or strike-slip dominated in the mixed sandstone/shale layers.
4.2.5. Displacements
Both the cumulative vertical (Figure 22) and horizontal (Figure 23) displacement patterns show important structural differences between the weak and strong Ahnet model. The internal deformation of the strong model, once more, is very similar to the deformation of the elastic Ahnet model (Figures 14 and 15), and is best described as stress-induced flexural amplification of the initial anticlinal structure. The only difference with the elastic model is the deformation at time zero when no horizontal shortening has been applied yet. Gravitational body force loading has led to plastic yielding in the Silurian shale layer, east and west of the anticline (Figure 18, top panel). The top panels in Figures 22 and 23 show that this has led to a decoupling of the parts of the model below and above the shale layer, and to sinistral motion across the shale layer west of the anticline and dextral motion east of the anticline; or, alternatively, both higher blocks have slided outerwards over the shale layer in yielding. The amount of the differential sliding is small, however, less than a metre, and is completely overprinted at later times by the vertical and horizontal displacements of tens of metres caused by the applied horizontal shortening. However, the decoupling and lubricating behaviour supports our assumption of ductile flow instead of brittle fracturing being the dominant yield deformation process in the shale layer.
| A) | B) | |
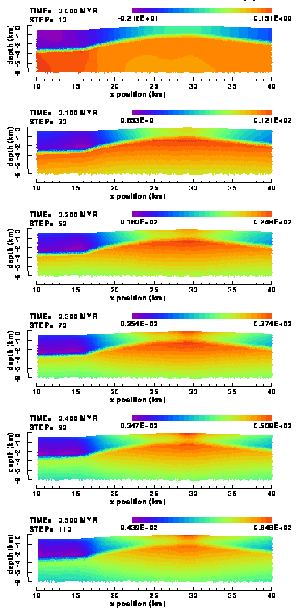 | 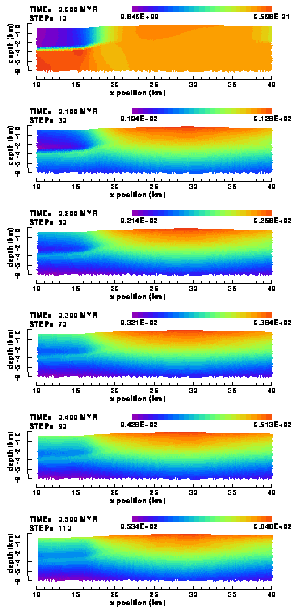 |
Figure 22. Colour contour images of the cumulative vertical displacements in the (a) "weak" and (b) "strong" elasto-plastic model of the Ahnet Basin without basement fault.
The same decoupling appears in the weak Ahnet model (Figures 22a and 23a), but here over the entire length of the model, as the entire Silurian shale layer is yielding under gravitational loading (Figure 18a). And although in the weak model also stress-induced flexural uplift of the anticline takes place, the major difference with the strong model is the on-going flexural slip east and west of the crest of the anticline. However, the blocks below and above the shale layer are slipping in reverse direction since the onset of horizontal shortening (Figure 23a). This means, and is indeed proven by Figure 22a, that the crestal region above the shale layer is being uplifted more than the crestal region below the shale layer. In other words, the shale layer is thickening in the crest. This is exactly what is observed in many fold structures containing sequences of more competent (sandstones) and less competent (shales) rocks.
| A) | B) | |
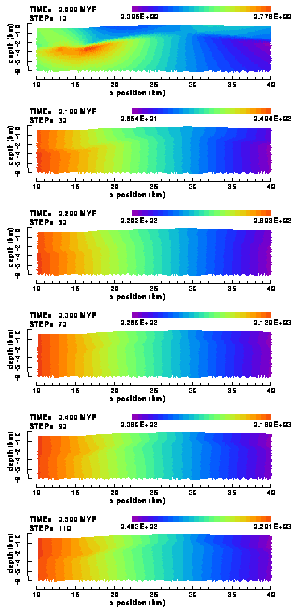 | 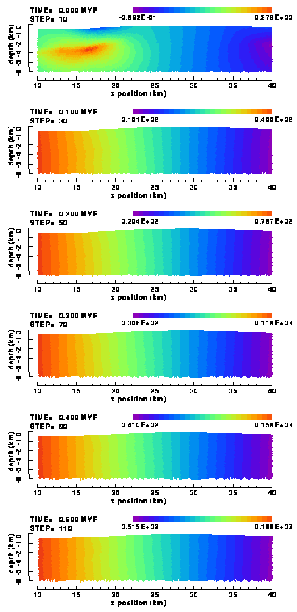 |
Figure 23. Colour contour images of the cumulative horizontal displacements in the (a) "weak" and (b) "strong" elasto-plastic model of the Ahnet Basin without basement fault.
The substantial differences in internal deformation between the weak and strong model of the Ahnet Basin demonstrate the important role played by the rock cohesion values in the entire deformation process. It is, therefore, of major importance to better constrain these values for the rocks of the Ahnet Basin.
5. AHNET FAULT MODEL
The configuration of this Ahnet fault model are displayed in Figure 24 (same as panel c in Figure 9). The boundary and loading conditions are the same as in the Ahnet model without basement fault. The presence of the fault, however, introduces one more model parameter: the fault friction. In the first section of this chapter, a fault model without friction will be investigated. The second section describes the results for several fault models, each with a different level of fault friction.

Figure 24. Schematic illustration of the boundary and loading conditions of the model of the Ahnet Basin with listric basement fault. For this model, only non-linear elasto-plastic analyses are carried out.
For all fault models, only non-linear elasto-plastic calculations are carried out. Each fault model will be analysed for two different sets of materials, one with a low, the other with a high rock cohesion (see Table 1).
5.1. Ahnet model with frictionless fault
5.1.1. Plastic deformation
A first glance at Figure 25 shows that the presence of the fault has produced a solution completely different from the non-fault Ahnet models. The only similarity between the non-fault and fault models is the rapid yielding of the Silurian shale layer, thus introducing possible mechanical decoupling and differential motion of the parts of the model below and above the shale layer.. In the non-fault models the plastic yielding typically is distributed and of low intensity within the Palaeozoic sedimentary layers (natural fracturing), and is expanding slowly, following the stratigraphic boundaries, under increasing compression. In the fault models, however, rock failure is characterised by distributed fracturing in the sedimentary layers and by intense localised yielding in spots and in narrow bands (mesoscale faults) in the hanging wall in the western half of the Garret El Gueffoul anticline (Figure 25).
| A) | B) | |
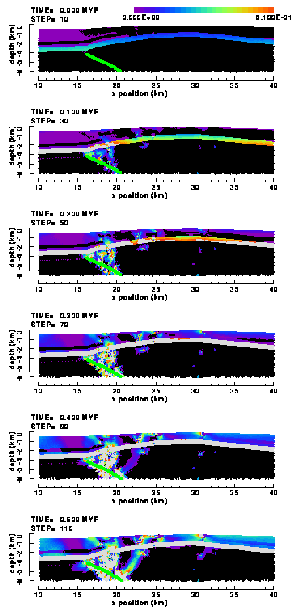 | 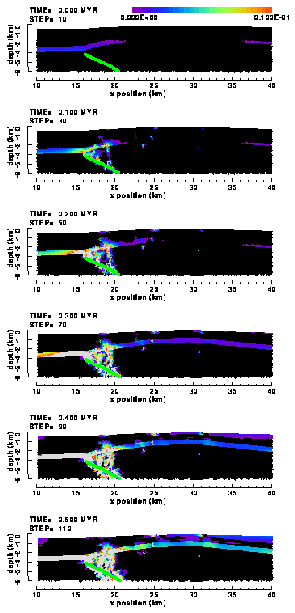 |
Figure 25. Colour contour images of the accumulated effective plastic strain in the (a) "weak" and (b) "strong" elasto-plastic model of the Ahnet Basin with listric basement fault (no friction). Black denotes elements not subjected to yielding yet. In grey elements the intensity of total plastic strain has exceeded the upper contouring limit. In this and following figures, the basement fault is outlined by green and/or red dots. If a dot is green, the fault is locally free to slip at that very moment; a red dot signals a locally locked fault.
In both the weak and strong model plastic shear bands initiate
at the basement fault and subsequently propagate upwards at a
steep to perpendicular angle with the basement fault. Although
not really clear, the shear bands in the strong model seem to
be narrower than in the weak model. Anyway, in both models the
bands propagate upwards through the Precambrian basement and the
Cambro-Ordivician sandstone layer into the Silurian shale layer.
The shear bands do not seem to be able to directly continue through
the shale layer; they terminate/die/are absorbed due, most likely,
to the ductile flow properties of the shale. The bands, however,
do affect locally the internal deformation in the shale layer,
since a new spot of plastic strain localisation develops at its
upper interface. This spot expands under enhanced loading and,
at least in the weak model, is the origin itself of new shear
bands which propagate, syn- and anti-thetically, upwards to the
model's upper surface.
Bands of localised plastic deformation also initiate directly
from the upper interface of the Silurian shale layer, as demonstrated
in Figure 25a. Here, at c. 23 km, even a synthetic and
antithetic band propagate upwards. Such a fault structure is also
observed, and at the approximately same position, in seismic sections
(Figure 6) across the Garret El Gueffoul anticline. Interesting
to see is how this double fault structure, when extrapolated to
the lower interface of the shale layer, after 0.3 Myr of compression
is being linked by a listric shear band with another intense plasticity
spot on the basement fault.
The development of distributed plastic yielding (fracturing)
in the Palaeozoic sediments is affected by the presence of localised
yielding, as demonstrated by the weak model (Figure 25a). In the
strong model where localisation has not occurred (yet) in the
sediments, distributed yielding takes place in the crest of the
anticline (Figure 25b, last panel), following the stratigraphic
boundaries while expanding, just like in the non-fault models
of the Ahnet Basin.
5.1.2. Proximity-to-failure
The development of spots and bands of localised, intense plastic deformation is illustrated also by the proximity-to-failure plots (Figure 26) of the frictionless fault model. This figure, furthermore, predicts, for both the weak and strong model, the development of a large antithetic planar zone in the Precambrian basement immediately east of the hinge line of the fold structure.
| A) | B) | |
 | 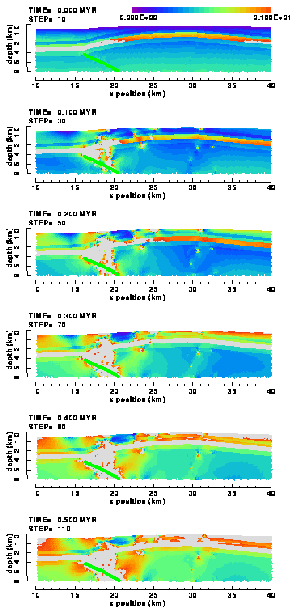 |
Figure 26. Colour contour images of the proximity-to-failure distribution in the (a) "weak" and (b) "strong" elasto-plastic model of the Ahnet Basin with frictionless listric basement fault (no friction). Grey colour denotes elements in failure.
Of interest in the strong model (Figure 26b) is the shallow segment
between 19 and 23 km position which remains far away from failure
while being abruptly limited by dipping zones in failure or close
to failure. This suggests the occurrence of block faulting in
the part of the model, with the segment behaving as a relatively
stable block limited by faults.
Another area remaining far away from failure is present in both
the weak and strong model within the Palaeozoic sediments in the
prolonged direction of the basement fault. This is surprising,
since one would expect under increased loading a concentration
of stresses and associated propagation of faulting in exactly
this direction. Perhaps the decoupling potential of the Silurian
shale layer plays in role in redistributing increasing stresses
in the continuation of the basement fault.
5.1.3. Differential stress
Plots of the differential stress distribution (Figure 27) indeed shows an increase in stress above the shale layer but only below the continuation of the basement fault in the upper Palaeozoic sediments. Above it, the differential stress remains small, less than 50 MPa. From the shale layer there is, however, a band of increased stress rising in opposite direction towards the model's surface. This explains the triangular shape of the area of low stress and far away from yielding (Figure 26b).
| A) | B) | |
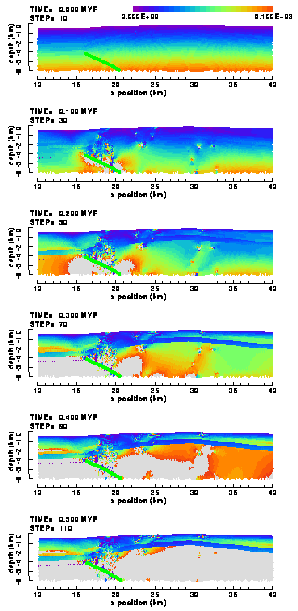 | 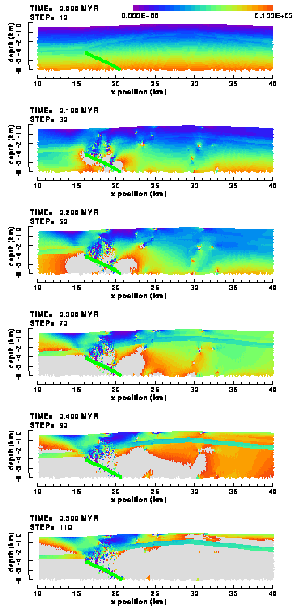 |
Figure 27. Colour contour images of the differential stress, 1-3, in the (a) "weak" and (b) "strong" elasto-plastic model of the Ahnet Basin with frictionless, listric basement fault (no friction).
Differential stress distribution and magnitudes are remarkably similar between the weak and strong Ahnet fault models, although the stress levels are higher in the sedimentary layers east of the crest of the anticline. Here stresses reach a level of more than 100 MPa in the strong model, while remaining below 60 MPa in the weak model. Stress patterns in the western half of the anticline are affected strongly by the occurrence of distributed and localised plastic yielding in the upper parts of both models. Here, stress levels in large areas do not exceed a few tens of MPa. In contrast, stress levels continue to increase in the Precambrian basement up to more than 100 MPa.
5.1.4 Principal stress ratio
The spatial distribution of the principal stress ratio (Figure 28) within the weak and strong model are very much alike. It is for large parts of both models also similar to the distribution of the non-fault models (Figure 21), although substantially different in the hanging wall in the western half of the Garret El Gueffoul, particularly in the early phases of the compressional loading.
| A) | B) | |
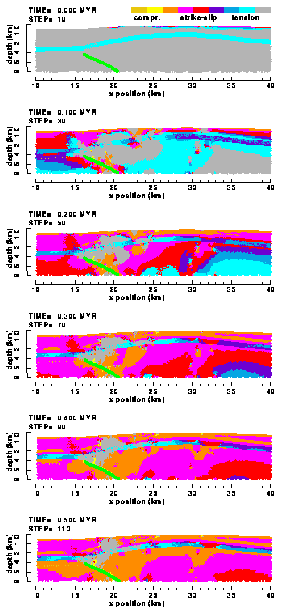 | 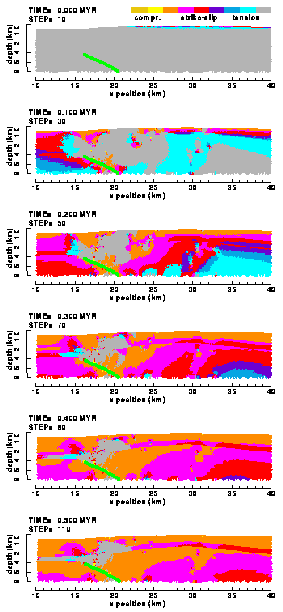 |
Figure 28. Colour contour images of the principal stress ratio R in the (a) "weak" and (b) "strong" elasto-plastic model of the Ahnet Basin with frictionless, listric basement fault (no friction).
Striking feature in both models is the continuing presence of a region in a tensile state of stress (grey coloured) in the hanging wall close to the tip of the basement fault. The reason of existence of this region remains unclear, just as its implications (a region of potential normal faulting in a compressive regime?)
5.1.5. Displacements
Whereas deformation of the non-fault Ahnet models is characterised by compression induced flexural uplift of the anticline (Figures 14, 15, 22 and 23), the patterns of horizontal and vertical displacements in the fault models (Figures 29 and 30) are dominated by differential motion along the frictionless basement fault. Internal deformation in the weak and strong model is almost identical, in spatial distribution as well as in intensity.
| A) | B) | |
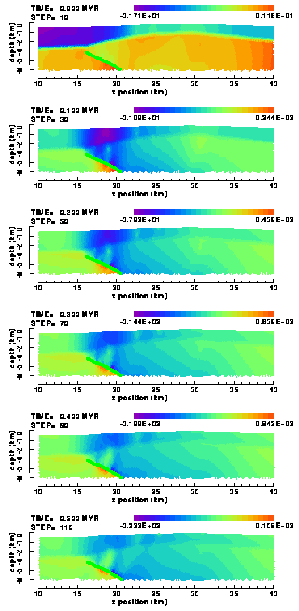 | 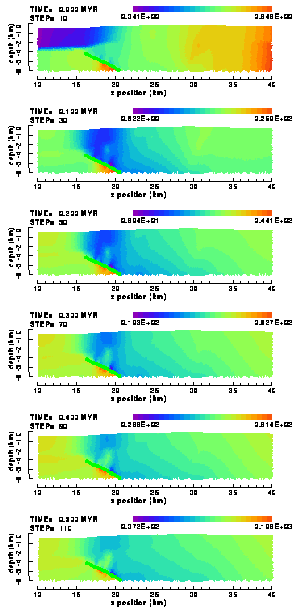 |
Figure 29. Colour contour images of the cumulative vertical displacements in the (a) "weak" and (b) "strong" elasto-plastic model of the Ahnet Basin with frictionless, listric basement fault (no friction).
A returning phenomenon is the mechanical decoupling of the sedimentary layers above and below the Silurian shale layer, resulting in a substantial crestwards motion of the upper layers relative to the deeper parts of the model. The amount of differential motion is difficult to estimate from the figures, but is clearly larger for the weak Ahnet model.
| A) | B) | |
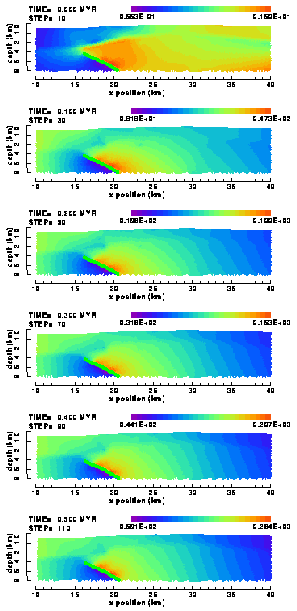 | 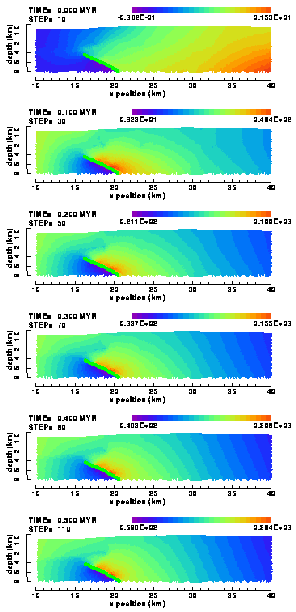 |
Figure 30. Colour contour images of the cumulative horizontal displacements in the (a) "weak" and (b) "strong" elasto-plastic model of the Ahnet Basin with frictionless, listric basement fault (no friction).
The anomalous bands of vertical displacement in the hanging wall between the basement fault and the shale layer evidently are the result of the intense plastic deformation taking place in this part of the model (Figure 25).
5.2. Ahnet model with friction along the entire basement fault
In this section the effect of adding friction to the entire basement fault will be described. Whereas in the frictionless models the only mode of contact on the fault plane is perfect sliding under any locally resolved non-zero shear stress, the introduction of friction allows two more possible modes: sticking and sliding. In the numerical model, any discrete point of the fault will be sticking until the frictional criterion, eqn. (3.26), is satisfied by the local stress field. The fault will then be unlocked locally and sliding is allowed (although not necessarily has to occur). Sliding may continue until the frictional criterion is no longer satisfied, at which moment the fault will be locked again.
5.2.1. Fault activity
Weak and strong Ahnet models with a friction coefficient increasing
from 0 to 0.8 in steps of 0.1 have been investigated. The effect
of different friction on the activity of the basement fault is
displayed for all models in "fault activity diagrams".
Such a diagram is similar to a standard seismic reflection profile
(like Figure 6), in which each trace displays the vertical displacement
through time of a point at the Earth' surface. A trace in a fault
activity diagram displays the increment in differential slip through
time for a point of the fault. Horizontally the traces for each
fault point, the first trace for the fault tip in the west, the
last trace for the fault point that connects the listric part
with the flat part of the basement fault. Vertically runs time
in Myr (millions of years). The amplitude of the wiggles along
the traces represent the magnitude of fault slip increment.
Figure 31 displays fault activity diagrams for friction coefficients
of 0.1, 0.2 and 0.3, each of these applied to the weak and strong
cohesion model of the Ahnet Basin. Activity of only the listric
part of the basement fault is displayed, as the horizontal part
remains locked at all times for all friction levels. Furthermore,
results show that for frictions of 0.4 and higher, the entire
basement fault stays locked, at least during the first 0.5 Myr
of applied horizontal shortening.
| A) | B) | |
 |
 |
Figure 31. Fault activity diagrams of the listric segment of the basement fault for weak (a) and strong (b) Ahnet models and for frictions of 0.1 (top), 0.2 (middle) and 0.3 (lower) applied to the entire fault. See text for explanation of the diagram.
Figure 31 shows that small variations in fault friction play
a much more important role than the one order change in magnitude
of the cohesion of the rocks on the locking and unlocking of the
basement fault, and thus on entire stress and strain development
in the models of the Ahnet Basin. Two major patterns seem to be
recognisable in the slip activity of the listric fault. The first
is the occurrence of slip along a central segment of the listric
fault during the early phase of compression. Both the length of
the slipping fault segment and the duration of the slip decrease
with increasing friction. The second pattern is slip of the upper
half of the listric fault. The onset of slip on this part of the
fault increases with increasing friction, although for a friction
of 0.1 slip already occurs from time zero on. A physical explanation
for the spatial and temporal features of the first pattern remains
unclear. The second pattern, however, can be explained, although
not easily, in terms of increasing fault depth, decreasing fault
dip, an increasing horizontal stress acting on the fault, and
increasing friction.
The results show that for frictions in excess of a level somewhere
between 0.3 and 0.4, the basement fault remains locked for the
range of compressional loading applied to the models in this study.
These models deform in the same way as the non-fault Ahnet model
described in Chapter 4. The non-fault model, which also can be
thought off as a fault model with infinite friction, and the zero-friction
fault model form the end-members of a series of fault models in
which friction is sufficiently low to allow differential displacement
along parts of the faults during a certain amount of time. The
characteristic stress and strain distributions of the end-member
models both return in the frictional fault models, the relative
contribution of each depending on the level of friction. It must
be understood, however, that the frictional models are not simply
a linear addition of the end-member models.
5.2.2. Plastic deformation
To illustrate this transitional concept, Figure 32 shows the effective plastic strain distribution in the weak Ahnet fault models with friction coefficients of 0.1, 0.2 and 0.3. This series is completed by also including Figures 18a (infinite friction) and 25a (zero friction) in the comparison. Figure 32 clearly shows that the development of plastic strain localisation in spots and bands decreases with increasing friction, in particular between a friction of 0.1 and 0.2. For a friction of 0.1 the distribution closely resembles the results of the frictionless fault model (Figure 25a). For frictional levels of 0.2 and higher, plastic shear bands no longer develop and high intensity plastic straining only occurs in a small zone close to the fault and, at somewhat less intense, in a wide spot close to the surface at the western end of the Garret El Gueffoul anticline. Strain localisation at this hinge/kink line position also takes place in the non-fault Ahnet model (Figure 18a).
5.2.3. Displacements
The changing relative influence of both end-member models on the intermediate frictional models is perhaps best demonstrated by the vertical displacements (Figure 33). This figures clearly illustrates that with increasing fault friction compression-induced flexural uplift of the anticline more and more dominates the gross deformation of the Garret El Gueffoul. The reverse is a decrease of slip, particularly along the uppermost parts of the basement fault, with increasing friction. The decoupling of the parts of the model above and below the ductile shale layer remains present in all models regardless of the friction.
6. PALAEOZOIC AHNET FAULT MODEL
The configuration of this Ahnet fault model is displayed in Figure 34 (same as panel d in Figure 9). The foot wall is restricted to move horizontally, and a convergent velocity is applied only to the hanging wall. With these boundary and loading conditions, this fault model is less representative for the Cenozoic deformation history of the Ahnet Basin, characterised by regional Alpine compression. Instead, it intends to model the final phase of the formation of the Garret El Gueffoul fold structure under Hercynian compression, assuming that the fold is formed by motion along a deeper basement fault in a process such as displayed in Figure 34. This analysis is carried out in order to investigated if the mesoscale faults observed in the anticline (Figure 6) could have been formed already during the Hercynian deformation of the Ahnet Basin. If this is the case, these faults may then have been only reactivated, not formed under Cenozoic Alpine compression. This, of course, does not mean that no new faults may have been formed in the Cenozoic.

Figure 34. Schematic illustration of the boundary and loading conditions of the "Palaeozoic" fault model of the Ahnet Basin in which the entire foot wall is fixed horizontally and a velocity is applied only to the hanging wall. To facilitate gliding of the hanging wall, no friction is assigned to the horizontal part of the basement fault.
Both models with a completely frictionless basement fault and models with friction are investigated. However, in the frictional models friction is assigned only to the listric part of the basement fault in order to facilitate sliding of the hanging wall. For all models, only non-linear elasto-plastic calculations are carried out, and only for the low rock cohesion materials (Table 1) since these are expected to lead faster to fault generation (as indeed is confirmed by the results of the previous models).
6.1.1. Plastic deformation
Figure 35 displays the accumulated effective plastic strain in
the models with a friction of (a) 0.0, (b) 0.1 and (c) 0.2 on
the listric segment of the basement fault. The most prominent
difference with the previous models is the absence plastic strain
localisation in spots and/or shear bands in the Precambrian basement
and associated localisation in the overlying Palaeozoic sediments.
Localisation in the basement does occur but only close to the
basement fault. Some localisation also occurs in the sedimentary
layers, typically in the crestal region of the anticline. These
layers also undergo distributed, low intensity fracturing, particularly
in the somewhat weaker sandstone/shale layers. And, as in the
previous models, the Silurian shale rapidly fails under increasing
compression, most likely exhibiting ductile flow, and, therefore,
once again having the potential to decouple the upper sedimentary
layers from the basement.
Localisation in the sediments above the shale seems typically
to occur west and east of the crest of the anticline. Although
the western localisation roughly coincides with observed faults
(Figure 6), it does not appear to develop as localised shear bands
which are supposed to represent fault planes. It is, however,
still possible that shear bands may develop here under further
compressional loading of the model. In contrast, shear banding
seems to take place, although not really convincingly, in the
eastern area of strain localisation. But for this location, no
faults have been detected in the seismic sections through the
Garret El Gueffoul anticline (Figure 6). The model results suggest,
therefore, that the faults observed on the seismics are more likely
to be of Alpine origin instead of reactivated Hercynian structures.
6.1.2. Fault activity
The reduction, or even disappearance, of fault localisation in the hanging wall is expressed also on fault activity diagrams for several levels of friction (Figure 36), which show that fault activity is substantially less intense. Fault activity is also distributed over the entire listric fault and not restricted to the upper half, although with increasing friction fault activity withdraws more and more to the shallower parts of the listric fault.
| A) | B) | |
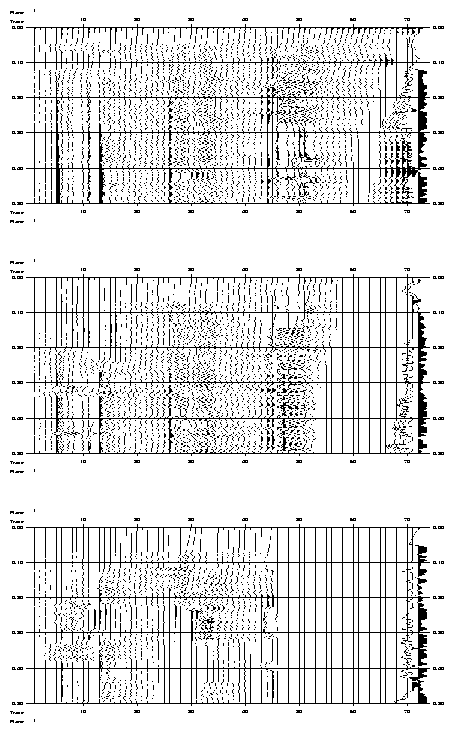 |
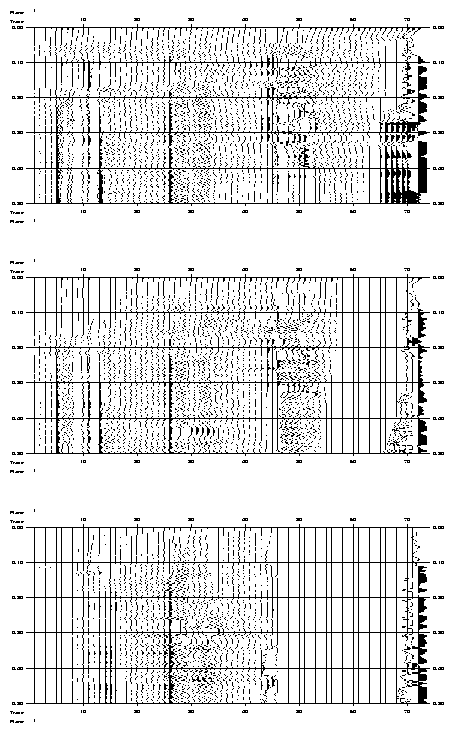 |
Figure 36. Fault activity diagrams of the listric segment of the basement fault for weak "Palaeozoic" Ahnet fault models, for frictions of 0.1 (top), 0.2 (middle) and 0.3 (lower) assigned to the listric fault.
Although fault slip occurs along large parts of the listric fault,
several distinct segments with more slip can be recognised. Such
active slip zones appear around trace 10, 30 and 50 (and perhaps
70 too in Figure 36a), at depths of c. 5, 9 and 13 (and
15) km, respectively. These zones persist under increased loading
although seemingly less continuous at higher friction levels.
It is unclear why these distinct zones with increased fault slip
appear, and why at such a pseudo-constant interval (in terms of
traces). Is this a structural phenomenon, or is there a numerical
cause?
Figure 31 also reveals the occurrence of slip "events"
along the fault, such as, for instance, the two clear events in
Figure 31a around trace 50 between 0.4 and 0.5 Myr, or the two
events in Figure 13b around trace 10 after 0.3 Myr.. Events seem
to be restricted to the active slip zones and to occur "instantaneously",
at least there is no evidence that the events propagate up- and/or
downwards along the fault. There is no recognisable pattern in
the occurrence of events for each model, just as there is no mutual
similarity between the models.
6.1.3. Proximity to failure
In contrast to the difference in activity along the basement fault,
the proximity-to-failure of the sediments and basements of the
various frictional models is remarkably similar. It is characterised,
as shown for the frictionless model (Figure 37), the occurrence
of distributed fracturing in both the Devonian sandstone/shale
layers, starting in the crest of the anticline and laterally propagating
under increased compression. The Upper-Devonian sandstone, in
general, remains away from fracturing during the first 0.5 Myr
of compression, except for the crest of the anticline where fracturing
seems to be facilitated by fracturing in the adjacent layers and
by the occurrence of localised deformation (faulting).
Failure in the basement occurs only close to the basement fault,
as already observed in the plasticity diagrams (Figure 35). The
failure proximity distribution in the basement is spatially compartimentalised
under influence of mesoscale faulting and plastic strain localisation
in the overlying sedimentary layers. This may lead to some kind
of block faulting of the basement under enhanced mechanical loading.
6.1.4. Differential stress
The same resemblance between the different frictional models appears
in the diffential stress distributions, for the frictionless model
depicted in Figure 38. Remarkably are the low stress magnitudes
in the sedimentary layers when compared to the Ahnet fault models
discussed in Chapters 4 and 5 (see Figures 20 and 27). Stresses
stay below 50 MPa, even in the uppermost kilometre of the Precambrian
basement where before stresses rapidly exceeded 100 MPa. This
may explain the absence of localised plastic deformation, in particular
the formation and grow of plastic shear bands, in the hanging
wall of the basement.
The stresses in the basement can also been seen to be spatially
divided into two or three compartiments, caused probably, as mentioned
before, by the downwards expanding influence of localised plastic
deformation in the overlying sedimentary layers. Across compartments,
stress jumps of several to a few tens of MPa may occur (Figure
38).
Similar with all other elasto-plastic Ahnet models is the low
stress level of a few tens of MPa in the Silurian shale layer,
due to its specific rheological properties, in particular its
low friction angle (Table 1).
6.1.5. Displacements
Although the vertical (Figure 39) and horizontal (Figure 40) displacements
of the analysed frictional models again show a great similarity,
this time there are also clear structural differences. The general
picture is that of the hanging wall sliding westwards (Figure
40) over the basement fault forced by the horizontal velocity
applied at its eastern margin (Figure 34).
In all models the mechanical decoupling of the shallow Palaeozoic
sediments from the Precambrian basement by the ductile flowing
Silurian shale layer also appears again. The direction of this
flexural slip is dominated by the gravitational loading at time
zero, due to which the topmost layers are sliding downwards over
both flanks of the fold, thus with sinistral slip on the west
flank and dextral slip on the east flank. The velocity boundary
condition also leads to flexural slip across the shale layer,
however only in the hanging wall and with a dextral sense of shear
over the entire anticline: the topmost layers can less easily
move westwards because of the continuity of these layers across
the entire model whereas the lower layers in the hanging wall
have the possibility to slide westwards over the basement fault.
As the magnitude of the latter slip mechanisms increases with
shortening, the location of inversion from sinistral to dextral
slip moves from the crest of the anticline towards the tip of
the basement fault (Figure 40).
The above described internal decoupling of the shallower and
deeper layers within the hanging wall implies a concentration
of deformation within the hanging wall close to the termination
of the basement fault, since it is here where all the westward
motion of the hanging wall culminates. This is indeed demonstrated
by the vertical displacements which are maximal in the decoupled
lower part of the hanging wall and typically occur in the triangular
area formed by the basement fault and the Silurian shale layer
(Figure 39). The maximum uplift, furthermore, develops progressively
more concentrated and closer to the tip of the basement fault
when there is less friction. This seems logical since with increasing
friction the models have shown to behave more and more as a non-fault
model in which the vertical deformation was characterised by flexural
amplication of the pre-existing fold structure. Compared with
the non-fault model, however, here it is primarily the decoupled
deeper part of the hanging wall which is flexurally amplified.
The uplift is hardly transmitted to the shallow parts of the hanging
wall, but absorbed by lateral ductile flow within the shales.
This, once again, shows the major control of this layer on the
deformation, and associated faulting and fracturing, of the fold
structures within the Ahnet Basin, especially when they were formed
under Hercynian compression.
7. DISCUSSION AND SYNTHESIS
The finite element models used in this study are based on seismic
sections, borehole data and surface geology, which are representative
only for the most recent structural geometry of the Ahnet Basin.
The models, therefore, are not allowed to deform to such an extent
that their final geometry deviates substantially from the initial
state. The amount of shortening applied to the models, therefore,
remains small, less than 0.5% (500 m over a length of 100 km),
which, however, still is an arbitrary amount. Knowledge of the
magnitude of the present-day stresses in the Ahnet Basin, for
instance from hydraulic fracturing tests in the boreholes, might
help to better define the loading history of the numerical models.
Knowledge of the stress magnitudes is also required to determine
the cohesion of the sedimentary rocks. The numerical results show
that both the low and high cohesion models deform in essentially
the same way but under different levels of compression: a lesser
shortened "weak" model produces the same stress and
strain patterns as a more shortened "strong" model.
So, without knowledge of the amount of compression the models
cannot be used to determine the cohesion of the rocks.
Alternatively, if the rock's cohesions are known, for instance
from direct measurements on borehole samples, the numerical models
provide a means to determine the magnitude of the intraplate stresses.
In this case, the models have to be compared with the data to
determine the load level which gives the best fit. The results
presented in this study indicate that in particular the vertical
uplift/subsidence of the surface is the best parameter to be tested
between numerical models and data. Unfortunately, no such data
are available for the Ahnet Basin.
Even worse, the in this context only available and useful data
are the presence and location of mesoscale faults in the Palaeozoic
sediments, observed on the seismic sections. And these data are
less useful in the determination of stress levels, since they
will typically provide only a lower limit of stress below which,
theoretically, no faults have formed yet. This is even worse for
the numerical models in which faults develop not instantaneously
in a brittle way, but more gradually by plastic shear strain localisation.
On the other hand, the presence and location of the faults in
the western flank of the Garret El Gueffoul anticline support
the existence of a listric basement fault: the faults develop
only when compression-induced slip occurs along such a fault.
The model results furthermore indicate that the faults most likely
are formed recently under Alpine compression. The faults could
be of Hercynian origin and be reactivated under Alpine compression,
but in that case not-reactivated Hercynian faults are predicted
to exist also in the eastern flank, for which, however, is no
seismic evidence.
The numerical models show that the (static) friction coefficient
along the listric basement fault has to be small, less than 0.4
(equivalent to a friction angle of less than 20), to generate
any slip (at least during the first 0.5 Myr of shortening) and
thus to result in secondary faulting in the basement and sediments
of the hanging wall in the western flank of the anticline. The
model results, furthermore, indicate that the formation of such
secondary faults is facilitated significantly when the friction
coefficient is less than 0.2 (friction angle of 11). This implies
the presence of structural water, which has a lubricating effect,
in the deeper parts of the Ahnet Basin (Chiarelli, 1978). The
0.4 friction coefficient for complete locking of the basement
fault is small, in particular when compared to the value of 0.85
obtained from laboratory experiments on dry rock samples (Byerlee,
1978). The calculated lower locking friction may well be caused
by the changing geometry of the listric part of the fault, notably
the fault dip and fault depth (Sibson, 1974). Both the normal
and shear stresses acting on the fault plane will change spatially
with these two parameters (Sibson, 1974). They, furthermore, will
change in time, controlled by the gravitational loading in the
early phases of compression, and by the horizontal shortening
during the later phases. As a result, different segments of the
listric part of the basement fault may slip at different moments.
The when and where of this localised slip will most likely depend
on the slip history of the entire fault, and thus be non-linear.
Rock failure (faulting, fracturing, ductile flow) in the Ahnet Basin
In the finite element modelling, rock failure is treated numerically
as plastic flow. This plastic flow, however, can be interpreted
geologically as either brittle deformation (faulting, fracturing)
or as ductile flow, depending on the type of rock. In the models
for the Ahnet Basin, the Silurian shale layer is expected to flow
ductilly when yielding, whereas the other Palaeozoic layers and
the Precambrian basement are expected to develop distributed fracturing
and/or localised faulting.
The more fluid-like deformation of the shale layer is supported
by the models, which show the occurrence of fluxural slip of the
overlying sedimentary layers relative to the underlying layers,
in particular across the fold structure. The shale layer also
mechanically decouples this shallow and deeper parts of the model
in a vertical sense, as shown by the difference in vertical uplift
of these model segments. The shale layer also plays an important
role in the transmission or absorption of upwards or downwards
propagating differential motion along secondary faults. There
is, furthermore, a clear example, in the numerical models as well
as in the seismic data, of the branching of a secondary fault
at the upper interface of the shale layer.
The more competent sandstone and sandstone/shale layers in the
Ahnet models develop both distributed and highly localised brittle
deformation, although the latter only in those models where differential
slip along the listric basement fault occurs. Distributed yielding
in the form of natural fracturing typically develops along the
stratigraphic boundaries, and faster in the mechanically weaker
sandstone/shale layers than in the stronger sandstone layers.
In all models fracturing starts at greater depths east and west
of the anticline, and subsequently propagates upwards along the
flanks along the stratigraphic interfaces. Fracturing may also
start in the crest of the anticline, from there on propagating
downwards. The latter, however, occurs predominantly in the high
fault friction models where the fold structure is substantially
uplifted, and where, therefore, fracturing seems to be flexurally
controlled.
The numerical models are particularly succesfull in predicting
localised yielding in shear bands, interpreted as mesoscale faulting.
Faults are predicted to appear only in the western half of the
Garret El Gueffoul anticline, which is confirmed by the seismic
data. Several faults are computed at their correct location, and
for one fault observed branching is indeed predicted to occur
at the upper interface of the Silurian shale layer. These matches
provide a strong support for the use of numerical modelling of
deformation of geological structures with hydrocarbon potential.
Especially since knowledge of the formation of faults and natural
fracturing play a major role in the economically succesfull exploration
of such structures.
8. CONCLUSIONS
The numerical model study of the Ahnet Basin, Algeria, presented
in this rapport indicates that slip along a deeper basement fault
is required to initiate localised mesoscale faulting in the Garret
El Gueffoul fold structure. The fault distribution is best predicted
by a model in which a pre-existing listric basement fault of probably
Hercynian origin is (partially) reactivated under Alpine compression
in the Cenozoic. Compression induced distributed fracturing of
the competent sedimentary layers expands predominantly laterally
along the stratigraphic boundaries. Flexural amplification of
the fold, which strongly depends on the level of friction along
the basement fault, also generates natural fracturing, which,
however, is initiated in the crest and subsequently propagates
downwards along the flanks of the fold. The weak strength and
ductile flow properties of the Silurian shale layer lead to a
mechanical decoupling between the shallower and deeper parts of
the Ahnet Basin. Across the fold structure this decoupling results
in flexural slip of the shallow sedimentary layers over the shale
layer.
The successful prediction of the fault distribution in the Ahnet
Basin proves that numerical modelling is a useful tool in the
analysis of sedimentary basins in order to improve hydrocarbon
recovery. Application of numerical methods, however, requires
data to constrain the model results. To improve results for the
Ahnet Basin, the cohesion values of the rocks need to be determined
from borehole samples, and subsidence analyses should be carried
out to obtain data on the vertical uplift/subsidence across the
fold structure. And, if possible, hydraulic fracturing should
be carried out in the boreholes in order to get an indication
of the magnitude of the present-day levels of horizontal stress
in the Ahnet Basin. Finally, more knowledge on the geometry of
the basement fault, a critical feature in the numerical models,
can be obtained directly by deeper seismics, or indirectly by
analysis of, for instance, of gravimetric or magneto-telluric
data.
Future numerical models of the Ahnet Basin may be constructed
from geometrically restored seismic sections, which will allow
an improved structural reconstruction of potential hydrocarbon
traps. Finally, with the currently computational power, three-dimensional
modelling of sedimentary basins such as the Ahnet Basin should
be considered. This, obviously, will lead to a substantially better
understanding of the formation and deformation of sedimentary
basins.
BIBLIOGRAPHY
- Aouine, S., 1990. Etude structurale par sismique reflexion dans le Permis in Salah. Sonatrach Exploration, rapport interne.
- Badsi, M., 1993. Failles et fractures dans le bassin de l'Ahnet. Apport du retraitement sismique. Memoire DEA Geosciences ENSPM.
- Beekman, F., 1994. Tectonic modelling of thick-skinned compressional intraplate deformation. PhD thesis, Vrije Universiteit, Amsterdam, 152 pp.
- BEICIP-SONATRACH, 1970. Synthese du Cambro-Ordovicien du Sahara Algerien. Rapport interne.
- Beuf, S., Biju-Duval, B., De Charpal, D., Rognon, R. & Bennacef, A., 1971. Les gres du Paleozoique inferieur au Sahare. Sedimentation et discontinuites: Evolution structurale d'un craton. Publications Institut Français du Pétrole College Science et Technologie du Pétrole 18, Technip ed. Paris, 464 p.
- Biju-Duval, B., De Charpal, D. & Nekabit, D., 1966. Constance des directions des paleocourants dans les gres de base du Cambro-Ordovicum sur le pourtour du Hoggar. C.R. Acad. Sci. Fr., t. 262, 48-50.
- Boudjema, A., 1987. Evolution structurale du bassin pétrolier Triasique du Sahara Nord-Oriental (Algérie). Unpublished PhD. Thesis, Université Paris-Sud.
- Byerlee, J. D., 1978. Friction of rocks. Pure and Applied Geophysics 116, 615-626.
- Carmichael, R.S., 1989. Practical handbook of physical properties of rocks and minerals, 741 pp. CRC Press, Boca Raton, Florida.
- Chiarelli, A., 1978. Hydrodynamic framework of eastern Algerian Sahara -- influence on hydrocarbon occurrence. American Association of Petroleum Geologists Bulletin 62, 667-685.
- Demaison, G. and Huizinga, B.J., 1991. Genetic classification of petroleum systems. American Association of Petroleum Geologists Bulletin 75, 1626-1643.
- Dixon, J.E. & Robertson, A.H.F. (eds.), 1984. The geological evolution of the eastern Mediterranean. Special Publication of the Geological Society, London, No. 17.
- Geller, R.J., 1988. Elastodynamics in a laterally heterogeneous, self-gravitating body. Geophysical Journal International 94, 271-283.
- Goodacre, A.K. & Hasegawa, H.S., 1980. Gravitationally induced stresses at structural boundaries. Canadian Journal of Earth Sciences 17, 1286-1291.
- Guiraud, R. & Maurin, J.-C., 1992. Early Cretaceous rifts of Western and Central Africa, an overview. Tectonophysics 213, 153-168.
- Jaeger, J.C. & Cook, N.G.W., 1976. Fundamentals of Rock Mechanics. Chapmann and Hall, London.
- Klemme, H.D. & Ulmishek, G.F., 1991. Effective petroleum source rocks of the World: stratigraphic distribution and controlling depositional factors. American Association of Petroleum Geologists Bulletin 75, 1809-1851.
- Klitsch, E., 1970. Structural development of parts of North Africa since Cambrian time. In: Symposium on Geology of Libya, Gray, C. (ed.), Libyan Petroleum Exploration Society, 253-262.
- Love, A.E.H., 1944. A treatise on the mathematical theory of elasticity. 643 pp., Dover Publications, New York.
- Macgregor, D.S., 1996. The hydrocarbon systems of North Africa. Marine and Petroleum Geology 13(3), 329-340.
- Melosh. H.J. & Raefsky, A., 1980. The dynamical origin of subduction zone topography. Geophysical Journal of the Royal Astronomical Society 60, 333-354.
- Melosh. H.J. & Raefsky, A., 1981. A simple and efficient method for introducing faults into finite element computations. Bulletin of the Seismological Society of America 71, 1491-1400.
- Melosh. H.J. & Williams, C.A., 1987. Mechanics of graben formation in crustal rocks: A finite element analysis. Journal of Geophysical Research 94(B10), 13961-13973.
- Sassi, W. & Faure, J.L., 199?.
- Scholz, C.H., 1990. The mechanics of earthquakes and faulting. University Press, Cambridge.
- Sibson, R.H., 1974. Frictional constraints on thrust, wrench and normal faults. Nature 249, 542-544.
- Sonder, L.J., 1990. Effects of density contrasts on the orientation of stresses in the lithosphere: Relation to principal stress directions in the transverse ranges, California. Tectonics 9(4), 761-771.
- Timoshenko, S.P. & Woinowsky-Krieger, S., 1959. Theory of plates and shells. 580 pp., McGraw-Hill, Singapore.
- Tissot, B., Espitalie, J., Deroo, G., Tempere, C. & Jonathan, D., 1973. Origin and migration of hydrocarbons in the Eastern Sahara (Algeria). In: Petroleum Geochemistry and Basin Evolution, Demaison, G. (ed.), American Association of Petroleum Geologists Bulletin No. 35, 315-334.
- Van Wees, J.D., 1994. Tectonic modelling of basin deformation and inversion dynamics. PhD thesis, Vrije Universiteit, Amsterdam, 164 pp.
- Zienkiewicz, O.C. & Taylor, R.L., 1988. The finite element method, 4th edition, Volume 1. McGraw-Hill, New York.
- Zienkiewicz, O.C. & Taylor, R.L., 1989. The finite element method, 4th edition, Volume 2. McGraw-Hill, New York.
- Zoback, M.L., 1992. First- and second-order patterns of stress in the lithosphere: The World Stress Map Project. Journal of Geophysical Research 97(B8), 11703-11728.
FIGURE CAPTIONS
Figure 32. Colour contour images of the accumulated effective plastic strain in the "weak" elasto-plastic model of the Ahnet Basin with listric basement fault and for a friction of (a) 0.1, (b) 0.2 and (c) 0.3. For higher friction coefficients the fault remains locked (at least, during the first 0.5 Myr of shortening).
Figure 33. Colour contour images of the cumulative vertical displacements in the "weak" elasto-plastic model of the Ahnet Basin with listric basement fault and for a friction of (a) 0.1, (b) 0.2 and (c) 0.3.
Figure 35. Colour contour images of the accumulated effective plastic strain in the weak elasto-plastic "Palaeozoic" fault model of the Ahnet Basin, for frictions of (a) 0.0, (b) 0.1 and (c) 0.2. Friction is assigned only to the listric segment of the basement fault in order to facilitate sliding of the hanging wall.
Figure 37. Colour contour images of the proximity-to-failure distribution in the weak model of the Ahnet Basin with frictionless listric basement.
Figure 38. Colour contour images of the differential stress, 1-3, in the weak model of the Ahnet Basin with frictionless listric basement.
Figure 39. Colour contour images of the cumulative vertical displacements in the weak model of the Ahnet Basin with listric basement fault and for a friction of (a) 0.0, (b) 0.1 and (c) 0.2
Figure 40. Colour contour images of the cumulative horizontal displacements in the weak model of the Ahnet Basin with listric basement fault and for a friction of (a) 0.0, (b) 0.1 and (c) 0.2.
Address
dr Fred Beekman
Institute of Earth Sciences, Vrije Universiteit
De Boelelaan 1085
1081 HV Amsterdam
The Netherlands
Phone: +31-20-4447339
Fax: +31-20-6462457
Last Modified: August 5, 1996.
 beef@geo.vu.nl
 Return to my home page