The long-term
impact of global deforestation on climate
Hans Renssen
Faculty of Earth Sciences, Vrije Universiteit Amsterdam, The Netherlands
Hugues Goosse and
Thierry
Fichefet
Institut dAstronomie et de Géophysique Georges Lemaître,
Université Catholique de Louvain, Louvain-la-Neuve, Belgium
Introduction
Forests are known to play an important role within the coupled climate
system. At a regional scale, for instance, deforestation in the tropics
in recent decades has led to reduced evaporation and increased surface
temperatures1. These effects have been reproduced in many climate
model studies2-4. The strong effect at a regional scale raises
an important question: what would happen to the global climate if the deforestation
would occur at a continental or even global scale? This is a relevant question
in the light of ongoing anthropogenic deforestation due to e.g., commercial
logging and population increase5. Moreover, in the geological
past, there have been periods during which the global forest cover was
much more reduced than today, for instance at the last glacial maximum6
(21 thousand years ago) and at the CretaceousTertiary boundary (65 million
years ago), when a giant bolide impact probably caused global deforestation7.
To study the impact of global deforestation on the climate system, we
have conducted a 1750-year long experiment with a global, coupled atmosphere-sea
ice-ocean-vegetation model.
Model and experiment
We performed our experiment with the ECBilt-CLIO-VECODE coupled atmosphere-ocean-vegetation
model8-10. The model consists of three components:
(1) ECBilt, a atmospheric model (T21, three layers) based on quasi-geostrophic
equations8,
(2) CLIO, a oceanic general circulation model coupled to a comprehensive
dynamic-thermodynamic sea-ice model9, and
(3) VECODE, a model that describes the dynamics of grassland and forest,
and desert as a third dummy type10.
As a first step, we have run the model with preindustrial forcings (i.e.
AD 1750) until an equilibrium state was reached after 1600 years. In this
state, the global fractions of land surface covered by forest, grassland
and desert were 42%, 40% and 18%, respectively.
As a second step, we instantly replaced all forest by grassland, after
which the model was run for another 1750 years with a 0% forest cover.
A new equilibrium vegetation was reached after 100 years following the
perturbation, with 80% of the land surface covered by grassland and 20%
by desert.
Results
Time series
The global deforestation produces an abrupt 2.6% increase in the global
surface albedo, which in turn leads to an instantaneous reduction in the
surface temperature (from 15.2°C to 14.1°C, see figure). This abrupt
cooling is followed by a more gradual temperature decrease lasting until
year 600 (to 12.8°C), which is associated with an expansion of the
sea-ice cover in both hemispheres, increasing the surface albedo further
by 1.6%. As expected, the surface cooling is accompanied by an intensification
of the thermohaline ocean circulation (THC), since cooler waters are denser,
stimulating deep mixing in the northernmost North Atlantic Ocean. However,
around year 600, the strength of THC is abruptly reduced, as shown by the
decline in the export of North Atlantic Deep Water (NADW) at 20°S from
21 to 16.5 Sv (1 Sv = 106 m3/s). This shift is caused
by the sea-ice expansion in the Nordic Seas, leading to stabilization of
the water column and thus to a reduction of the deep mixing between Iceland
and Norway. As a result of the THC weakening, the Nordic Seas become permanently
ice-covered, as can be seen in the increase in arctic sea-ice cover after
year 600 (see figure). In turn, this leads to further global cooling, with
the global surface temperature decreasing from 12.8 to 12.3°C.
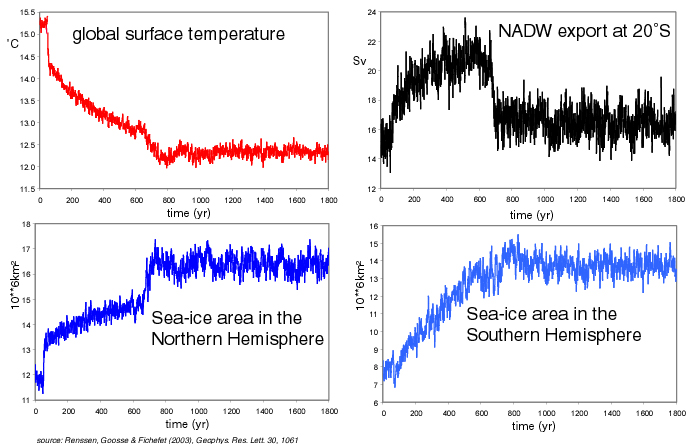
Evolution of annual mean values of several model variables in response
to global deforestation introduced after year 50 (the first 50 years represent
the pre-industrial equilibrium): global mean surface temperature (°C),
Northern Hemisphere sea-ice area (106 km2),
Southern Hemisphere sea-ice area (106 km2),
southward export of North Atlantic Deep Water at 20°S (Sv).
Global distribution
At the end of our experiment, the strongest cooling (20°C) is
present over the Nordic Seas, where the initial deep convection site has
become ice-covered. The sea-ice expansion produced also substantial cooling
(6 to 10°C) over the Arctic and Southern Oceans.
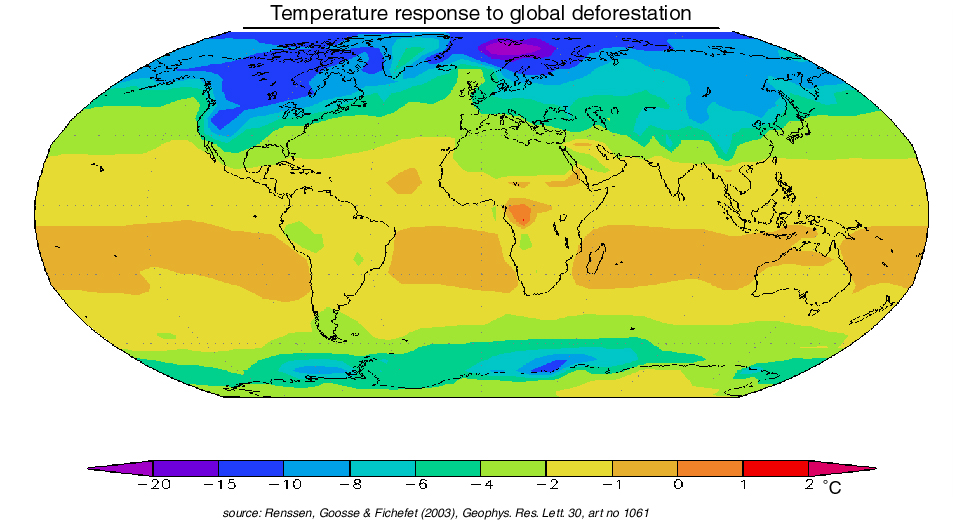
Annual mean surface temperature anomaly (°C): deforested
state (year 750-800) minus pre-industrial (year 1-50)
In addition, surface temperatures over the North American continent
are markedly lower (more than 10°C). These low temperatures are related
to accumulation of snow, since the summer temperatures are no longer sufficiently
high to melt the winter snow pack.
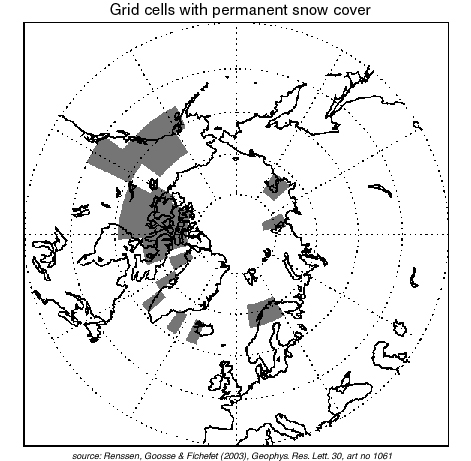
This map shows the grid cells (in grey) in which a permanent snow cover
develops during the simulation (Greenland is covered by an ice-sheet throughout
the experiment).
Summary
Our study confirms that forests play a very important role in the climate
system. Our results suggest that forests are essential for maintaining
the present interglacial climate state. Removal of the forest cover in
our model eventually leads to a very cold climate in which a perennial
snow cover develops in North America. Consequently, global deforestation
could possibly push the climate system into the glacial mode, with large
continental ice sheets in America and Eurasia.
Please consult the following paper for further information
Renssen, H., Goosse, H. & Fichefet, T. (2003), On the non-linear
response of the ocean thermohaline circulation to global deforestation,
Geophys.
Res. Lett. 30, art. no. 1061, doi: 10.1029/2002GL016155
References
-
Gash, J.H.C, C.A. Nobre, J.M. Robert and R.L. Victoria, Amazonian deforestation
and climate, Wiley, Chichester, 595 p., 1996.
-
Hahmann, A.N., and R. Dickinson, RCCM2-BATS model over tropical south America:
Application to tropical deforestation, J. Clim., 10, 1944-1964,
1997.
-
Lean, J., and P. Rowntree, Understanding the sensitivity of a GCM simulation
of Amazonian deforestation to the specification of vegetation and soil
characteristics, J. Clim., 10, 1216-1235, 1997.
-
Claussen, M., V. Brovkin and A. Ganopolski, Biogeophysical versus biogeochemical
feedbacks of large-scale land cover change, Geophys. Res. Lett., 28,
1011-1014, 2001.
-
Pahari, K., and S. Murai, Modelling for prediction of global deforestation
based on the growth of human population, ISPRS
Journal of Photogrammetry & Remote Sensing, 54, 317324,
1999.
-
Crowley, T.J. and S.K. Baum, Effect of vegetation on an ice-age climate
model simulation, J. Geophys. Res., 102,16463-16480, 1997.
-
Vajda, V., J.I. Raine, and C.J. Hollis, Indication of global deforestation
at the Cretaceous-Tertiary boundary by New Zealand Fern spike, Science,
294, 1700-1702, 2001.
-
Opsteegh, J.D., R.J. Haarsma, F.M. Selten and A. Kattenberg, ECBILT: a
dynamic alternative to mixed boundary conditions in ocean models, Tellus,
50A, 348-367, 1998.
-
Goosse, H., and T. Fichefet, Importance of ice-ocean interactions for the
global ocean circulation: a model study, J. Geophys. Res., 104,
23,337-23,355, 1999.
-
Brovkin, V., J. Bendtsen, M. Claussen, A. Ganopolski, C. Kubatzki, V. Petoukhov
and A. Andreev, Carbon cycle, vegetation and climate dynamics in the Holocene:
Experiments with the CLIMBER-2 Model, Global Biogeochem. Cycl.,
16(4), 1139, Doi:10.1029/2001GB001662, 2002
BACK TO HOME
To simulation
of the 8,200 yr BP Holocene cooling event
To simulation of the
termination of the African Humid Period at 6 kyr BP
To simulation of
atmospheric variability during stadial-interstadial transitions
To publication list
Hans Renssen