 (3.1)
(3.1)
|
Chapter 3 |
Garnet - melt trace element partitioning in the system FeO - CaO - MgO - Al2O3 - SiO2 (FCMAS) and quantification of crystal-chemical controls in natural systems |
Published as:
Van Westrenen, W., Blundy, J.D. and Wood, B.J. (2000a) Effect of Fe2+ on garnet-melt trace element partitioning: Experiments in FCMAS and quantification of crystal-chemical controls in natural systems. Lithos, in press. Copyright © Elsevier Science Ltd.
3.1 Abstract
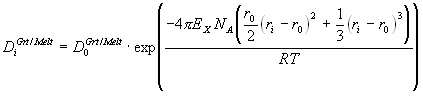
Garnet-melt trace element partitioning experiments were performed in the system FeO-CaO-MgO-Al2O3-SiO2 (FCMAS) at 3 GPa and 1540 ║C, aimed specifically at studying the effect of garnet Fe2+ content on partition coefficients (DGrt/Melt). DGrt/Melt, measured by SIMS, for trivalent elements entering the garnet X-site show a small but significant dependence on garnet almandine content. This dependence is rationalised using the lattice strain model of Blundy and Wood (1994), which describes partitioning of an element i with radius ri and valency Z in terms of three parameters: the effective radius of the site r0(Z), the strain-free partition coefficient D0(Z) for a cation with radius r0(Z), and the apparent compressibility of the garnet X-site given by its YoungÆs modulus EX(Z). Combination of these results with data in Fe-free systems (Van Westrenen et al. 1999a) and crystal structure data for spessartine, andradite, and uvarovite, leads to the following equations for r0(3+) and EX(3+) as a function of garnet composition (X) and pressure (P):
r0(3+) [Å] = 0.930 À XPy + 0.993 À XGr + 0.916 À XAlm + 0.946 À XSpes + 1.05 À (XAnd + XUv)
- 0.005 À (P[GPa] - 3.0) (▒ 0.005 Å)
EX(3+) [GPa] = 3.5 À 1012 À (1.38 + r0(3+) [Å])-26.7 (▒ 30 GPa)
Accuracy of these equations is shown by application to the existing garnet-melt partitioning database, covering a wide range of P and T conditions (1.8 GPa < P < 5.0 GPa; 975 oC < T < 1640 oC). DGrt/Melt for all 3+ elements entering the X-site (REE, Sc and Y) are predicted to within 10 - 40 % at given P, T, and X, when DGrt/Melt for just one of these elements is known. In the absence of such knowledge, relative element fractionation (e.g. DGrt/Melt(Sm) / DGrt/Melt(Nd)) can be predicted. As an example, we predict that during partial melting of garnet peridotite, group A eclogite, and garnet pyroxenite, r0(3+) for garnets ranges from 0.939 ▒ 0.005 Å to 0.953 ▒ 0.009 Å. These values are consistently smaller than the ionic radius of the heaviest REE, Lu. The above equations quantify the crystal-chemical controls on garnet-melt partitioning for the REE, Y and Sc. As such, they represent a major advance en route to predicting DGrt/Melt for these elements as a function of P, T and X.
3.2 Introduction
Detailed knowledge about the partitioning of trace elements between mantle phases (especially clinopyroxene and garnet) and co-existing silicate melts is critically important for mantle melting studies. The current controversy over the presence of garnet in the source of basaltic magmas formed below mid-ocean ridges (MORB) provides a good example. MORB Sm-Nd and Lu-Hf systematics (e.g. Salters 1996) and REE patterns (Shen and Forsyth 1995) appear to require the presence of garnet in the MORB source. Observed U-Th disequilibrium in present-day MORB (e.g. Bourdon et al. 1996) requires a mineral phase somewhere in the MORB source which retains U preferentially over Th, inferred to be garnet from partitioning experiments (e.g. Beattie 1993; LaTourrette et al. 1993; Hauri et al. 1994). Conversely, Blundy et al. (1998) and Wood et al. (1999), show that clinopyroxene can impose garnet-like signatures (i.e., compatibility of HREE and preferential retainment of U over Th) on near-solidus mantle melts, possibly obviating the need for any garnet in the source of many MORB. Experimentally derived differences between garnet-melt and clinopyroxene-melt partition coefficients (DGrt/Melt vs. DCpx/Melt) therefore play a crucial role in arguments both in favour of and against a critical role for garnet. This example illustrates the importance of taking into account variations in DGrt/Melt and DCpx/Melt with pressure (P), temperature (T), and bulk composition (X). Although considerable progress has been made in predicting variations in DCpx/Melt (Wood and Blundy 1997), to date no such model exists for garnet. This is particularly important in light of recent suggestions about the role of garnet pyroxenite veins in imposing the MORB ægarnet signatureÆ (e.g. Hirschmann and Stolper 1996; Blichert-Toft et al. 1999). Partial melting of these veins would involve garnet-melt equilibria at pressures, temperatures, and in compositions, which are all very different from those used in published garnet-melt partitioning experiments. There is therefore a need for a predictive garnet-melt partitioning model to fill these voids in the understanding of mantle melting.
In a previous paper (Van Westrenen et al. 1999a) we quantified the crystal-chemical effects on garnet - anhydrous melt trace element partitioning along the pyrope-grossular join, for trivalent elements entering garnet X-sites (e.g. REE, Sc and Y). To extend our modelling to natural systems, well-constrained data on iron-bearing systems are needed. We therefore performed anhydrous experiments in the system FeO - CaO - MgO - Al2O3 - SiO2 (FCMAS), specifically aimed at isolating the effect of garnet iron content on partitioning. Results are interpreted within the framework of the Blundy and Wood (1994) model, which describes partitioning of an element i with radius ri and valency Z in terms of three parameters: the effective radius of the site r0, the strain-free partition coefficient D0 for a cation with radius r0, and the apparent compressibility of the garnet X-site, given by its YoungÆs modulus EX.
(3.1)
In Equation 3.1, NA is AvogadroÆs number and R is the gas constant. Through combination with experiments in iron-free systems (Van Westrenen et al. 1999a), we derive predictive equations for r0(3+) and EX(3+) as a function of garnet composition. These provide important constraints on partitioning in natural garnet-melt systems. To illustrate this, we use our model to predict that during mantle melting, Lu is the most compatible REE in garnet under all relevant P, T and X conditions.
3.3 Experimental and analytical methods
Methods used for piston-cylinder experiments are identical to those described in Van Westrenen et al. (1999a). After doping with appropriate amounts of 1000-ppm atomic absorption standard solutions, starting materials were dried at 110 oC overnight, and then at 760 oC for 10 minutes (prior to welding). Around 10 mg of the starting mix was placed in 2 mm O.D. graphite-lined Pt capsules, which were embedded in alumina and surrounded by a double sleeve of silica glass and BaCO3. A pressure correction of -13%, derived from Al-in-pyroxene barometry (Perkins III et al. 1981), was applied to this configuration. Temperature was controlled to within 2 oC by a W-3%Re/W-25%Re thermocouple, and the thermal gradient across the sample is less than 20 oC. Starting materials were chosen to reproduce garnet-melt equilibria in FCMAS at 3.0 GPa (G. Gudfinnsson, unpublished data). Major element compositions of experimental products were determined with the University of Bristol JEOL 8600 electron microprobe, trace element levels (for Li, K, Sc, Ti, Sr, Y, Zr, Nb, La, Pr, Sm, Tb, Er, Yb, Lu, Hf, Ta, Re, U and Th) were measured with SIMS at the University of Edinburgh NSS Ion Probe Facility. Further details of starting mix preparation, analytical methods, their precision and accuracy can be found in Van Westrenen et al. (1999a).
3.4 Results
Compositions of starting materials are given in Table 3.1. These compositions were determined from glasses prepared from aliquots of starting oxide mixtures, melted in air for 30 minutes, at 1520 oC in unsealed Pt capsules. Concentrations of all trace elements were as expected from doping levels, with two exceptions: from the added amount of Re (520 ppm), only a small percentage (< 4%, see Table 3.1) remained in the glass. This can be explained by the high volatility of Re at higher temperatures in air (J. Brenan, pers. comm.). Conversely, Sr concentrations were higher than expected from the doping level, as a result of unavoidable Sr contamination in the CaCO3 used as a major component of our starting mix. Experimental conditions and products are given in Table 3.2. All experiments produced garnet, pyroxene and quench phase. Garnets were 40-100 m m in diameter, while pyroxenes were very small (generally <10 m m across). Major and trace element compositions of experimental products are given in Table 3.3. Pyroxene stoichiometries in experiments 16 and 18 are (Mg0.98Ca0.72Fe0.10Al0.19)(Si1.84Al0.16)O6 and (Mg1.22Ca0.23Fe0.44Al0.11)(Si1.92Al0.08)O6. The CaO content of the latter is very low (5.8 wt%), so this pyroxene could be described as an aluminous pigeonite. It is very close in composition to orthopyroxenes formed at virtually identical pressures and temperatures in a recent study of phase relationships in lunar mare basalts (Longhi 1992). Garnets have compositions Py72Gr19Alm9 and Py56Gr13Alm31 respectively, and no zoning was apparent in major elements. Garnets thus have virtually identical pyrope/grossular ratios (Py79Gr21 and Py81Gr19 respectively), but almandine contents spanning the majority of compositions found in EarthÆs upper mantle (Fig. 3.1). On the basis of calculated pyroxene and garnet stoichiometries, we find no evidence for significant amounts of Fe3+ in our crystals. fO2 calculations after Holloway et al. (1992) confirm that most of the Fe3+ remaining in the starting material (▒ 95%) was reduced to Fe2+ by the presence of the graphite capsule.
|
Table 3.1. Major and trace element compositions of glassed starting materials |
|||||
|
A (low Fe) |
B (high Fe) |
||||
|
Mean |
s |
Mean |
s |
||
|
FeO |
4.5 |
0.1 |
17.2 |
0.3 |
|
|
CaO |
12.4 |
0.1 |
9.50 |
0.1 |
|
|
MgO |
19.7 |
0.2 |
14.6 |
0.1 |
|
|
Al2O3 |
16.6 |
0.1 |
10.8 |
0.1 |
|
|
SiO2 |
46.1 |
0.2 |
45.2 |
0.2 |
|
|
Total |
99.2 |
0.3 |
97.3 |
0.4 |
|
|
n |
20 |
38 |
|||
|
Li |
39.1 |
0.8 |
38.5 |
0.6 |
|
|
K |
898 |
13 |
1181 |
23 |
|
|
Sc |
11.4 |
0.3 |
15.9 |
0.2 |
|
|
Ti |
50.9 |
0.8 |
59.3 |
0.7 |
|
|
Sr |
160 |
2 |
194 |
1 |
|
|
Y |
8.79 |
0.10 |
11.1 |
0.1 |
|
|
Zr |
22.0 |
2.4 |
23.6 |
1.6 |
|
|
Nb |
38.5 |
1.0 |
50.1 |
0.7 |
|
|
La |
162 |
2 |
48.2 |
0.6 |
|
|
Pr |
13.8 |
0.1 |
16.3 |
0.2 |
|
|
Sm |
9.43 |
0.26 |
13.0 |
0.4 |
|
|
Tb |
9.12 |
0.14 |
11.1 |
0.2 |
|
|
Er |
9.84 |
0.27 |
12.0 |
0.2 |
|
|
Yb |
9.20 |
0.13 |
11.6 |
0.1 |
|
|
Lu |
15.4 |
0.3 |
9.59 |
0.11 |
|
|
Hf |
13.4 |
0.7 |
16.5 |
0.4 |
|
|
Ta |
35.1 |
3.2 |
39.7 |
0.6 |
|
|
Re |
6.86 |
0.54 |
15.6 |
2.7 |
|
|
Th |
100 |
5 |
88.1 |
1.2 |
|
|
U |
33.6 |
1.3 |
29.6 |
0.5 |
|
|
Total |
1709 |
2216 |
|||
|
n |
4 |
5 |
|||
|
Note: Major elements in wt%; trace elements in ppm. |
|||||
|
Table 3.2. Experimental conditions and products |
||
|
16 |
18 |
|
|
Starting material |
A |
B |
|
Capsules |
C + Pt |
C + Pt |
|
P (GPa) |
2.9 |
3.0 |
|
T (║C) |
1540 |
1538 |
|
t (h) |
21.5 |
21.5 |
|
Products |
Grt (52a) |
Grt (25) |
|
Q (21) |
Q (65) |
|
|
Px (27) |
Px (10) |
|
|
a Proportions calculated from mass balance. Grt = garnet, Q = quenched melt, Px = pyroxene |
||
|
Table 3.3. Major and trace element composition of experimental products |
||||||||||||||||||||
16 (Grt: Py72Gr19Alm9) |
18 (Grt: Py56Gr13Alm31) |
|||||||||||||||||||
|
Grt |
s |
Px |
s |
Q |
s |
Grt |
s |
Px |
s |
Q |
s |
|||||||||
|
FeO |
4.84 |
0.30 |
3.32 |
0.09 |
6.26 |
0.08 |
15.80 |
0.48 |
14.68 |
0.30 |
18.94 |
0.71 |
||||||||
|
CaO |
7.71 |
0.54 |
18.80 |
0.20 |
14.49 |
0.47 |
5.18 |
0.33 |
5.80 |
1.80 |
9.87 |
0.54 |
||||||||
|
MgO |
20.80 |
0.52 |
18.28 |
0.25 |
17.14 |
0.54 |
15.73 |
0.43 |
22.44 |
1.70 |
13.19 |
0.54 |
||||||||
|
Al2O3 |
23.49 |
0.42 |
8.41 |
0.62 |
13.30 |
0.24 |
22.49 |
0.27 |
4.39 |
0.32 |
9.85 |
0.16 |
||||||||
|
SiO2 |
43.66 |
0.44 |
51.45 |
0.50 |
47.44 |
0.06 |
41.64 |
0.28 |
53.03 |
0.43 |
47.64 |
0.43 |
||||||||
|
Total |
100.49 |
0.66 |
100.26 |
0.47 |
98.64 |
0.15 |
100.84 |
0.38 |
100.33 |
0.33 |
99.48 |
0.37 |
||||||||
|
n (majors) |
22 |
6 |
3 |
14 |
5 |
14 |
||||||||||||||
|
Li |
1.58 |
0.76 |
70.8 |
3.1 |
0.37 |
0.08 |
20.6 |
43.3 |
0.8 |
|||||||||||
|
K |
152 |
40 |
11921 |
1460 |
2.94 |
0.95 |
18.5 |
2294 |
162 |
|||||||||||
|
Sc |
20.7 |
1.5 |
4.70 |
0.47 |
48.3 |
4.1 |
6.10 |
12.9 |
0.3 |
|||||||||||
|
Ti |
40.5 |
1.4 |
193 |
11 |
22.8 |
4.4 |
8.37 |
117 |
1 |
|||||||||||
|
Sr |
21.8 |
3.9 |
1204 |
66 |
0.71 |
0.15 |
8.44 |
293 |
8 |
|||||||||||
|
Y |
14.0 |
0.2 |
4.80 |
0.15 |
25.2 |
1.3 |
0.94 |
10.5 |
0.1 |
|||||||||||
|
Zr |
14.6 |
1.8 |
37.7 |
1.2 |
8.50 |
1.16 |
0.38 |
27.8 |
0.4 |
|||||||||||
|
Nb |
7.66 |
0.93 |
442 |
48 |
0.48 |
0.08 |
0.48 |
76.3 |
2.4 |
|||||||||||
|
La |
22.3 |
1.6 |
1212 |
67 |
0.22 |
0.02 |
0.81 |
74.8 |
3.3 |
|||||||||||
|
Pr |
3.60 |
0.42 |
84.7 |
2.9 |
0.65 |
0.12 |
0.47 |
24.9 |
0.9 |
|||||||||||
|
Sm |
7.04 |
0.57 |
30.0 |
0.9 |
3.96 |
0.50 |
0.66 |
19.1 |
0.3 |
|||||||||||
|
Tb |
11.1 |
0.5 |
9.59 |
0.12 |
13.5 |
0.7 |
0.90 |
12.9 |
0.4 |
|||||||||||
|
Er |
14.9 |
0.3 |
6.21 |
0.26 |
31.3 |
2.0 |
0.94 |
10.6 |
0.2 |
|||||||||||
|
Yb |
15.7 |
1.0 |
3.06 |
0.09 |
38.6 |
3.6 |
0.95 |
8.86 |
0.32 |
|||||||||||
|
Lu |
26.2 |
1.9 |
4.16 |
0.11 |
33.7 |
4.3 |
0.66 |
6.80 |
0.02 |
|||||||||||
|
Hf |
12.9 |
1.8 |
33.6 |
1.5 |
9.23 |
1.19 |
0.51 |
23.2 |
1.0 |
|||||||||||
|
Ta |
7.85 |
1.13 |
321 |
27 |
0.59 |
0.12 |
0.28 |
58.7 |
5.1 |
|||||||||||
|
Re |
1.28 |
0.44 |
0.74 |
0.27 |
2.63 |
3.12 |
0.61 |
1.47 |
0.21 |
|||||||||||
|
Th |
13.7 |
1.9 |
525 |
34 |
0.86 |
0.14 |
1.15 |
114 |
3 |
|||||||||||
|
U |
6.81 |
1.85 |
178 |
16 |
0.94 |
0.12 |
0.37 |
38.8 |
0.5 |
|||||||||||
|
n (traces) |
3 |
5 |
3 |
1 |
3 |
|||||||||||||||
|
Note: Major elements in wt%, trace elements in ppm. Grt = Garnet, Px = pyroxene, Q = Quench phase |
||||||||||||||||||||

Figure 3.1. Iron contents of garnets produced in this study span a significant part of the range found in mantle garnets. Mantle garnet data from compilations of Mottana (1986) and the authors. Light grey field: garnet compositions in group A eclogites. Dark grey field: garnet compositions in fertile garnet peridotites.
Pyroxene crystals were generally too small for SIMS analyses, only one crystal in experiment 18 could be analysed for trace elements.
Calculated partition coefficients (DGrt/Melt and DPx/Melt) are presented in Table 3.4. All trace elements reported here are incompatible in pigeonite, and values of DPx/Melt are in good agreement with opx-melt REE partitioning data from Salters and Longhi (1999). The highest D values are 0.48 for lithium, 0.47 for scandium, and 0.42 for rhenium. DPx/Melt for the HREE is around 0.1, which is about 10 times higher than D values for the LREE. U is slightly less compatible than Th, although the difference is small. These data could have use in future trace element models of melting in the lunar / Martian mantle. In agreement with previous experimental data (Righter and Hauri 1998), Re is compatible in garnet, although the error in DRe is large. This might be caused by the presence of a Re alloy phase in crystals and/or melt. Although no alloy blebs were observed during electron probe analysis, it is impossible to mass-balance Re in our experiments, and the blebs might have been too small to be detected. Li is very incompatible, as previously observed (Van Westrenen et al. 1999a). As expected, U is more compatible than Th in garnet. The HREE are compatible in garnet, with maximum D values for Lu up to 6.3. The LREE are two orders of magnitude less compatible than the HREE.
In Figure 3.2a, DGrt/Melt are compared with our previous results on Fe-free garnets at P and T conditions virtually identical to those applied here (Van Westrenen et al. 1999a). Patterns are very similar. Incompatible elements (i.e. those with DGrt/Melt < 1) are generally slightly more incompatible in Fe-bearing systems, while compatible elements (with DGrt/Melt > 1) are at the high end of the CMAS range. Fractionations between some geochemically important element pairs (U-Th, Zr-Hf, Nb-Ta) show significant variation with garnet composition. This is illustrated in Figure 3.2b, which shows data on DZr/DHf and DU/DTh from this study and Van Westrenen et al. (1999a).
|
Table 3.4. Garnet - melt and pyroxene - melt partition coefficients |
||||||
16 |
18 |
|||||
|
Element |
DGrt/melt |
s |
DGrt/melt |
s |
DPx/melt |
s |
|
Fe |
0.77 |
0.05 |
0.83 |
0.04 |
0.78 |
0.03 |
|
Ca |
0.53 |
0.04 |
0.52 |
0.04 |
0.59 |
0.19 |
|
Mg |
1.21 |
0.05 |
1.19 |
0.06 |
1.70 |
0.15 |
|
Al |
1.77 |
0.05 |
2.28 |
0.05 |
0.45 |
0.03 |
|
Si |
0.92 |
0.01 |
0.87 |
0.01 |
1.11 |
0.01 |
|
Li |
0.022 |
0.011 |
0.0084 |
0.0018 |
0.48 |
0.01 |
|
K |
0.013 |
0.004 |
0.0013 |
0.0004 |
0.0081 |
0.00057 |
|
Sc |
4.41 |
0.54 |
3.75 |
0.33 |
0.47 |
0.0092 |
|
Ti |
0.2 |
0.014 |
0.19 |
0.04 |
0.071 |
0.00037 |
|
Sr |
0.02 |
0.0034 |
0.0024 |
0.0005 |
0.029 |
0.00081 |
|
Y |
2.91 |
0.10 |
2.40 |
0.13 |
0.090 |
0.0011 |
|
Zr |
0.39 |
0.05 |
0.31 |
0.04 |
0.014 |
0.00019 |
|
Nb |
0.017 |
0.003 |
0.0062 |
0.0011 |
0.0062 |
0.00020 |
|
La |
0.018 |
0.002 |
0.0029 |
0.0003 |
0.011 |
0.00048 |
|
Pr |
0.043 |
0.005 |
0.026 |
0.005 |
0.019 |
0.00071 |
|
Sm |
0.23 |
0.02 |
0.21 |
0.03 |
0.034 |
0.00046 |
|
Tb |
1.16 |
0.05 |
1.04 |
0.07 |
0.070 |
0.0022 |
|
Er |
2.40 |
0.11 |
2.97 |
0.19 |
0.089 |
0.0017 |
|
Yb |
5.14 |
0.36 |
4.36 |
0.43 |
0.11 |
0.0039 |
|
Lu |
6.29 |
0.48 |
4.95 |
0.64 |
0.097 |
0.00031 |
|
Hf |
0.38 |
0.06 |
0.40 |
0.05 |
0.022 |
0.0010 |
|
Ta |
0.024 |
0.004 |
0.010 |
0.0022 |
0.0047 |
0.00041 |
|
Re |
1.73 |
0.87 |
1.79 |
2.14 |
0.42 |
0.060 |
|
Th |
0.026 |
0.004 |
0.0075 |
0.0013 |
0.010 |
0.00029 |
|
U |
0.038 |
0.011 |
0.024 |
0.003 |
0.0096 |
0.00011 |
|
Note: All values calculated using Table 3.3 |
||||||


Figure 3.2. (a) Spidergram comparing DGrt/Melt from this study with the range observed for experiments at similar P and T conditions in CMAS (Van Westrenen et al. 1999a). Error bars are 1s. (b) Variation of garnet-melt DZr/DHf and DU/DTh with garnet composition. Data taken from Table 3.4 and from Van Westrenen et al. (1999a). Symbols show garnet compositions, with calculated fractionations given adjacent to each point. 1s errors on all values are ▒ 10% relative. Light and dark grey fields encompass garnet compositions from group A eclogites and fertile garnet peridotites respectively.
Garnets with either high (Py + Alm), such as those found in fertile peridotites, or very high Gr contents, have DZr/DHf smaller than one. However, garnets with more intermediate compositions, closer to those found in eclogites, have DZr/DHf larger than one. These same garnets have significantly lower DU/DTh than found in more peridotitic garnets rich in (Py + Alm). Figure 3.2b clearly illustrates the importance of taking into account crystal-chemical variations when studying fractionation of element pairs during mantle melting involving garnet.
Plots of log(DGrt/Melt) versus ionic radius r ("Onuma diagrams") for divalent and trivalent trace elements entering the garnet X-site are given in Figure 3.3. The plots show a near-parabolic dependence of D on ionic radius, as observed first by Onuma et al. (1968) and borne out by later analyses on a wide range of mineral-melt pairs (e.g. Jensen 1973; Blundy and Wood 1991; Liu et al. 1992; Beattie 1994; LaTourrette et al. 1995; Brenan et al. 1995; Wood and Blundy 1997; Van Westrenen et al. 1999a). This near-parabolic dependence was quantified by fitting the data to Equation 3.1. Fitted curves are shown in Figure 3.3, and best-fit parameters given in Table 3.5. Fitted curves agree very well with the data, with the exception of La and Pr in experiment 16 (Fig. 3.3a), which have higher DGrt/Melt than expected from the fitted curve. This could be caused by the relatively small amount of melt (21 %, Table 3.2) in this experiment, leading to an increase by a factor of 6 in Pr and La in the course of the experiment, or by a very small amount of glass contamination (on the order of 1 %) during SIMS analysis of the garnet crystals. Neither of these scenarios would influence the DÆs of the other REE significantly. In this case, we believe the fitted curve gives a better description of the true D than the measured values.
As in the Fe-free experiments, r0(3+) < r0(2+), and EX(2+) < EX(3+). Values of EX are slightly higher than those for CMAS garnets, while r0 values are slightly smaller than or equal to lowest values for Fe-free experiments.


Figure 3.3. Onuma diagrams for experiments 16 (a) and 18 (b), showing DGrt/Melt for divalent and trivalent cations entering the garnet X-site (symbols) together with non-linear least-squares fits to Equation 3.1 (curves). Error bars (shown if bigger than symbols) are 1s . Ionic radii taken from Shannon (1976).
|
Table 3.5. Results of fitting partitioning data for divalent and trivalent cations entering the garnet X-site to Eqn. 3.1 |
||||
|
Py72Gr19Alm9 |
Py56Gr13Alm31 |
|||
|
Value |
s |
Value |
s |
|
|
r0(2+) |
0.964 |
0.027 |
0.983 |
0.006 |
|
D0(2+) |
1.0 |
0.2 |
1.3 |
0.1 |
|
EX(2+) |
156 |
56 |
265 |
18 |
|
r0(3+) |
0.938 |
0.002 |
0.934 |
0.001 |
|
D0(3+) |
7.9 |
0.4 |
6.1 |
0.3 |
|
EX(3+) |
680 |
50 |
585 |
35 |
|
Note: r0 in Å, EX in GPa |
||||
This qualitatively explains the incompatible element trends in Figure 3.2a: the smaller r0 and the higher E, the more incompatible (misfit) elements like U, Th, K in the X-site (and by analogy Hf, Zr in the Y-site) become. Higher values for compatible elements are reflected in high values of D0 (~7.9 and ~6.1 for experiments 16 and 18, compared with a maximum of ~4.8 in CMAS at similar T and P). As shown by Wood and Blundy (1997), D0 is partly determined by melt composition, but a quantification of this effect is beyond the scope of this paper. With regards to the pigeonite-melt data, we confine ourselves to remarking that predicted values of r0(3+) and EX(3+) for the pyroxene in experiment 18 for elements entering the M2 site (0.964 Å and 283 GPa, using Wood and Blundy 1997) are in excellent agreement with fitted values (r0(3+) = 0.964 ▒ 0.02 Å; EX(3+) = 269 ▒ 92 GPa). It therefore appears the clinopyroxene-melt model of Wood and Blundy (1997) can also be used to predict systematics of pigeonite-melt partitioning.
3.5 Discussion
Because the garnets produced in this study have a near-constant Py-Gr ratio (Py80▒1Gr20▒1) but very different almandine contents, the effect of almandine content on partitioning can be quantified. This is illustrated in Figure 3.4, which depicts r0(3+) as a function of almandine content. The value for iron-free garnets with composition Py80Gr20 is derived from our previous work in CMAS (Van Westrenen et al. 1999a). Figure 3.4 shows a small dependence of r0(3+) on almandine content in our experiments. Our extrapolated value for pure (Mg and Ca-free) almandine, 0.916 Å, compares favourably with the radius of the almandine X-site measured at ambient conditions (~0.915 Å, from the compilation of Smyth and Bish 1988).

Figure 3.4. Variation of r0(3+) in FCMAS garnets as a function of garnet iron content, at constant Py-Gr ratio (Py80Gr20). The value of r0(3+) for iron-free garnet (Py80Gr20Alm0) is taken from Van Westrenen et al. (1999a). Crystallographically determined X-site radius for almandine (triangle) from Smyth and Bish (1988). For explanation see text.
Combined with our previous work under similar P-T conditions we derive the following predictive equation for r0(3+) in FCMAS garnets at 3.0 GPa and ~1540 oC:
r0(3+) [Å] = 0.930 À XPy + 0.993 À XGr + 0.916 À XAlm (3.2)
Equation 3.2 shows that the r0(3+) we predict for pure almandine (0.915 Å) is lower than that for pure pyrope (0.930 Å), even though crystallographic data indicate that at ambient conditions the X-site is smaller in pyrope than in almandine. This might reflect small differences between garnet crystal structure for P-T versus ambient conditions, or alternatively it might be a result of the large and/or linear extrapolation from our experimental data (maximum of 31% almandine) to pure end-member almandine. We do believe Equation 3.2 is valid up to at least XAlm = 0.5, a range that incorporates the great majority of natural mantle garnet samples (e.g. Fig. 3.1).
Almandine, grossular and pyrope components together typically make up 70 to 90 % of mantle garnets. Fe3+ and Mn2+ contents are usually low (<1 wt% of the corresponding oxides Fe2O3 and MnO), as are Cr3+ contents in undepleted mantle rocks. Chromium is however an important component of mantle garnets in rocks that have gone through one or more stages of partial melting. In such depleted mantle rocks, Cr2O3 is present in the garnets at levels of 5-12 wt%. To take some account of the (generally small) influence of these components on r0(3+) we added terms to Equation 3.2 for end-members spessartine, andradite, and uvarovite, using as an estimate the radius of the relevant X-sites derived from crystallographic data at ambient conditions (Smyth and Bish 1988):
r0(3+) [Å] = 0.930 XPy + 0.993 XGr + 0.916 XAlm + 0.946 XSpes + 1.05 (XAnd + XUv) (3.3)
The numerical values in these last two added terms should be adjusted in the future when experiments aimed specifically at the influence of these components are performed. They do however give an indication of the probable influence of these components on r0(3+): large amounts of Cr and trivalent iron will tend to increase r0(3+), while spessartine has less influence as its X-site is intermediate in size between those of almandine, grossular and pyrope. To take into account the fact that garnet X-sites decrease in size with increasing pressure, we added a small pressure correction term to Equation 3.3,
r0(3+) [Å] = 0.930 À XPy + 0.993 À XGr + 0.916 À XAlm + 0.946 À XSpes + 1.05 À (XAnd + XUv)
- 0.005 À (P [GPa] - 3.0) (3.4)
The value of -0.005 Å / GPa is in close agreement with observations on the compressibility of the pyrope X-site (-0.0045 Å / GPa; Zhang et al. 1998). To assess the accuracy of Equation 3.4, comparisons between predicted and observed values of r0(3+) at different pressures and temperatures are needed. The existing data sets on natural garnet phenocryst or megacryst - matrix pairs (Irving and Frey 1978; Liu et al. 1992; Schnetzler and Philpotts 1970; Sisson and Bacon 1992) are unsuitable since P and T are not sufficiently well-constrained. Of 48 experiments found in the literature, only 8 are suitable: (a) They do not contain appreciable amounts of water (< 3 wt%) û Van Westrenen et al. (2000b) have shown that large variations in the melt co-ordination environment of trace elements, such as might result from the presence of significant amounts of water, could influence values of r0. (b) They contain more than three of the relevant trace elements, so that meaningful fits to Eqn. 3.1 can be made. (c) They include data for scandium. Exclusion of Sc from garnet-melt partitioning experiments is a major problem when trying to rationalise garnet-melt partitioning data, as illustrated in Figure 3.5a for an experiment from Salters and Longhi (1999). Weighted non-linear least squares regression of their data to Equation 3.1 leads to fitted values of r0(3+), D0(3+) and EX(3+) which are physically unrealistic (0.76 Å, 60, and 214 GPa respectively, all with large error bars; compare this with fitted values in Table 3.2). Without Sc it is impossible to constrain the left limb of fitted curves (i.e. for radii smaller than r0). Sc-free experiments therefore cannot be used for deriving P and T influence of r0(3+).
We thus compared predicted and fitted values of r0(3+) for three experiments from Barth et al. (1997), the experiment described by Hauri et al. (1994), and two each from Rocholl et al. (1996) and Withers (1997). Resulting agreement between predicted and fitted r0(3+) is good (Fig. 3.6): predictions are accurate to within 0.005 Å, a value within the error on the fitted values and smaller than the difference in radius between adjacent REE. We did not observe any dependence of r0 on T, that is, regressions including a T term returned a value that is zero within uncertainty.

Figure 3.5. Fits of Equation 3.1 to data from a garnet-melt partitioning experiment by Salters and Longhi (1999) [P = 2.8 GPa, T = 1537 oC]. (a) Unconstrained least-squares fit. (b) Fit incorporating predicted values of r0(3+) and EX(3+), using Eqns. 4 and 7.

Figure 3.6. Comparison between fitted values of r0(3+) and values predicted using Equation 3.4, for all existing Sc-bearing, H2O-poor experimental garnet-melt partitioning data. R = Rocholl et al. (1996), P = 5 GPa; B = Barth et al. (1997), P = 1.8 GPa; H = Hauri et al. (1994), P = 2.5 GPa; W = Withers (1997), P = 3.0 GPa. Error bars in fitted values are 1s .
The next requirement for a fully predictive model for garnet-melt partitioning is a relation between some garnet property or properties and the apparent YoungÆs modulus EX (or bulk modulus K, which is equivalent to 2/3 E) obtained form fitting data to Equation 3.1. It has long been known there is a close link between the bulk modulus of a substance and the nature and arrangement of its constituent atoms (e.g. Bridgman 1923). In the seventies, several workers derived empirical relations between K, composition and structure, for both bulk materials and their constituent polyhedra. For oxides and silicates, Hazen and Finger (1979) proposed an empirical relation between the volume of a cation-oxygen polyhedron (taken to be d3, where d = r0 + 1.38 Å, the radius of O2-), the charge Zc of the cation occupying the polyhedron, and the bulk modulus K of the corresponding cation oxide:
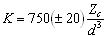 (3.5)
(3.5)
Equation 3.5 shows that both a small polyhedral volume and a high cation charge can result in a high value of K. Equation 3.5 shows some promise for application to mineral-melt partitioning models: analyses of partitioning data for series of trace elements with identical charge Zc, using Equation 3.1, provide fitted values for both K (i.e. 2/3 E) and d (i.e. rOxygen + r0). Wood and Blundy (1997) tested whether K and d derived from partitioning data agree with Equation 3.5, and found reasonable agreement for Zc = 1, 2 and 3 for clinopyroxene- and plagioclase-melt pairs. Were Equation 3.5 to hold for garnet-melt partitioning data, it could be used in conjunction with Equation 3.4 to predict EX(3+) as a function of garnet composition and P. However, Figure 3.7 shows that Equation 3.5 cannot be used to predict KX(3+) (and hence EX(3+)) for 3+ elements entering the garnet X-site: fitted values of KX(3+), for the experiments in this study, our previous study (Van Westrenen et al. 1999a), and the 8 Sc-bearing experiments shown in Fig. 3.6, are markedly higher (by up to a factor of 2) than predicted with Eqn. 3.5, especially at high values of Zc/d3 (i.e. at small X-site volumes). These high E values are difficult to reconcile with any model of garnet elasticity. Recently, computer simulations of trace element incorporation into garnets (Van Westrenen et al. 2000b) have shown that the co-ordination number of both major and trace elements in the melt can influence the apparent site modulus E derived from partitioning data. Specifically, the lower the co-ordination number of a trace element in a melt, the higher the apparent E derived from partitioning studies between garnet and

Figure 3.7. Bulk modulus K versus cation charge (Zc) divided by cation-oxygen distance cubed (d3) derived from garnet-melt partitioning data. Error bars are 1s . The large discrepancy between partitioning data and relation found by Hazen and Finger (1979; Eqn. 3.5) for polyhedra in oxides is apparent. Dotted line is power law fit to the data (Eqn. 3.6).
that melt. Clearly, more work needs to be done to find a satisfactory theoretical model for the variation seen in Fig. 3.7. In the absence of such a model, we have to take a more empirical approach. The garnet-melt data appear to show a power law dependence of K on V (= d3, see the dotted line in Fig. 3.7). Such a dependence is in accordance with Anderson (1972), who shows that K À Vy = constant for iso-structural groups of elements, oxides, halides, and sulphides. For oxide data, y is close to 1, in agreement with Equation 3.5. Fitting the partitioning data to a power law (dotted line in Fig. 3.7) gives
KX(3+) [GPa] = 2.3 À 1012 À (V [Å3])-8.9 = 2.3 À 1012 À (1.38 + r0(3+) [Å])-26.7 (3.6)
The best-fit value of y (8.9) is outside the range found by Anderson (1972) for oxides, halides, elements, and sulphides (1 < y < 5), another indication that a factor other than garnet elasticity must influence K derived from partitioning studies. For trivalent cations entering the garnet X-site, the apparent site YoungÆs modulus can be estimated by assuming a PoissonÆs ratio of 0.25:
EX(3+) [GPa] = 1.5 À KX(3+) = 3.5 À 1012 À (1.38 + r0(3+) [Å])-26.7 (3.7)
with a standard deviation of around 30 GPa.
Imposing predicted r0(3+) and EX(3+) onto experiments without Sc increases the plausibility of fits dramatically, shown in Figure 3.5b for an experiment of Salters and Longhi (1999). It is important to note that the data in this figure were not used as input for the model, and the quality of the fit is a true reflection of predictive capabilities. Eqns. 3.4 and 3.7 work equally well for all æanhydrousÆ experiments not used as input in the model, and also seem applicable to experiments containing larger (> 3 wt%) amounts of water (e.g. Green et al. 2000). The latter observation suggests that, contrary to the concerns expressed earlier, water does not have a significant bearing on r0. This emphasises once again the overriding influence of crystal properties on partitioning behaviour. Overall, partition coefficients for the HREE, Y and Sc are reproduced to within ~10 % relative in the 48 experimental data sets; the error can be larger (up to ~40 %) for the LREE, primarily because partition coefficients are low (< 0.1). Of course, D0 is still a fitted parameter at this stage, so that the true accuracy of our model might be somewhat overestimated. A full evaluation of the accuracy of our models must await development of predictions for D0(3+). It is clear, however, that the equations derived above can be used to predict with reasonable accuracy garnet-melt partition coefficients under a wide range of P, T and X conditions. At this stage, knowledge of just one DREE/Y/Sc is sufficient to predict DGrt/Melt for all other REE, Sc and Y to within 10 û 40 % relative. And even in the absence of such knowledge, important information about relative values of partition coefficients can be obtained. As an illustration of this last point, we discuss some implications of our model for mantle melting in the presence of garnet.
3.6 Implications for mantle melting
There are several garnet reservoirs in the EarthÆs upper mantle, e.g. undepleted and depleted garnet peridotites, group-A eclogites, garnet pyroxenite veins and so on. These reservoirs are present at a wide range of P and T conditions, and garnet major element compositions generally also differ between and within reservoirs (e.g. Fig. 3.1). It should be clear from the foregoing discussion that variations in P, T and X all influence partition coefficients. Figure 3.2b illustrates this point for some important trace element pairs (Zr-Hf and U-Th). Our data show that at the same P and T, partial melting of eclogites may lead to fractionation of these pairs that is at least different from, and plausibly opposite to, that expected by partial melting of fertile garnet-bearing peridotites.
For the REE, Y, and Sc we now have a means of quantitatively assessing the influence X has on DGrt/Melt. To this end we collected major element data from the literature on a wide range of mantle garnets, and used Equation 3.3 to predict values of r0(3+) (i.e., to a first approximation we neglected the small influence of pressure on r0(3+)). We predict that r0(3+) during partial melting of fertile garnet peridotite is almost constant at 0.939 ▒ 0.005 Å (number of garnets n = 17). Garnets in pyroxenite veins impose values of r0(3+) in the range 0.932-0.943 Å (n = 26). Depleted garnet reservoirs show slightly higher values: r0(3+) = 0.953 ▒ 0.009 Å for garnets in a wide range of depleted mantle xenoliths (n = 126) and 0.941 ▒ 0.007 Å (n = 117) for group A eclogites (Garnet major element data from MacKenzie and Canil 1999; Matsyuk et al. 1998; Robinson and Wood 1998; Stachel et al. 1998; Brenker and Brey 1997; Harte and Kirkley 1997; OÆReilly and Griffin 1995; Beard et al. 1992; Bell and Rossman 1992; Sen and Leeman 1991; Bodenier et al. 1987; Irving 1974; Boyd and Nixon 1972). Significantly, these values are all considerably smaller than the radius of the smallest REE, Lu (r = 0.977 Å). As a consequence, during mantle melting in the presence of virtually any natural mantle garnet, DLu will always be larger than DGrt/Melt of any other REE, as well as Sc and Y. One implication of our prediction is that the flat HREE patterns found in the experiments of Hauri et al. (1994), with DEr > DYb > DLu, are probably erroneous. Another implication, stemming from the link between r0(3+) and E in Equation 3.7, is that EX(3+) varies from ~520 GPa for garnets found in depleted mantle xenoliths to ~620 GPa for garnets in undepleted peridotites. Both lower values of r0(3+) and higher values of EX(3+) in garnets from fertile mantle will cause a larger fractionation between adjacent REE. For instance, at 1500 ░C and 3 GPa, an undepleted garnet (r0(3+) = 0.939 Å, EX(3+) = 620 GPa) is predicted to have a DGrt/Melt(Sm) / DGrt/Melt(Nd) of 5.1, while we predict a value of 3.4 for a depleted garnet (r0(3+) = 0.953 Å, EX(3+) = 520 GPa) under the same P and T conditions.
3.7 Conclusions
We have presented new experimental garnet-melt partitioning data in the simple system FCMAS. Interpretation of our data using the model of Blundy and Wood (1994) yields equations for the variation of r0(3+) and EX(3+) as a function of garnet composition and pressure. It is important to realise that these equations could not have been derived from the existing garnet-melt database alone, largely because of (a) the scarcity of Sc partitioning data with which to constrain the size of the garnet X-site, and (b) the interdependence of composition, P and T in experiments on natural compositions. To disentangle these interdependencies, experiments in simple systems, at constant P and T conditions, are essential. Although the experiments discussed in this paper are not directly applicable to natural garnet-melt systems because of their particular combination of P, T and X conditions, at least as much information is derived from them as from experiments aimed at mimicking as closely as possible ænaturalÆ conditions.
Although our model is not yet fully predictive (absolute values of DGrt/Melt cannot be predicted unless DGrt/Melt for one isovalent cation entering the same garnet lattice is known), Equations 3.4 and 3.7 provide valuable insights into the variation of garnet-melt partition coefficients during mantle melting in the presence of garnet. What is required for a fully predictive model now is knowledge of the variation of D0 as a function of P, T and melt composition.
Back